The International Tinnitus Journal
Official Journal of the Neurootological and Equilibriometric Society
Official Journal of the Brazil Federal District Otorhinolaryngologist Society
ISSN: 0946-5448

Google scholar citation report
Citations : 12717
The International Tinnitus Journal received 12717 citations as per google scholar report
The International Tinnitus Journal peer review process verified at publons
Indexed In
- Excerpta Medica
- Scimago
- SCOPUS
- Publons
- EMBASE
- Google Scholar
- Euro Pub
- CAS Source Index (CASSI)
- Index Medicus
- Medline
- PubMed
- UGC
- EBSCO
Volume 22, Issue 1 / June 2018
Research Paper Pages:1-9
Divergent Responses in the Gap Prepulse Inhibition of the Acoustic Startle Reflex in Two Different Guinea Pig Colonies
Authors: Leggett K, Mendis V, Mulders WHAM
PDF
Abstract
Animal models of tinnitus rely on interpretation of behavioural or reflexive tests to determine the presence of this phantom perception. A commonly used test is the gap prepulse inhibition of acoustic startle (GPIAS), which is often combined with prepulse inhibition (PPI) to ensure that reduced GPIAS suppression is not due to hearing loss caused by the acoustic trauma commonly used to trigger tinnitus development. In our laboratory GPIAS and PPI are routinely used on two colonies of outbred tri-colour guinea pigs. However, our results show that these colonies show divergent results even before any tinnitus-inducing treatment, which impacts their suitability in tinnitus models. Although colony 1 and 2 show similar results in PPI (~95% of animals showing significant suppression), only ~30% of colony 2 also shows significant suppression in GPIAS compared to ~75% of colony 1. Cochlear sensitivity measured using compound action potentials showed no significant differences between colonies. Therefore, peripheral threshold loss was excluded as a possible factor. Our results show that similar strains of laboratory animals can show highly divergent results and GPIAS testing for tinnitus will not work for every animal strain. In addition, our data support the notion that PPI and GPIAS responses may rely on different neural circuitry.
Keywords: tinnitus, compound action potential, gap prepulse inhibition, guinea pig, audiogram
Abbreviations
CAP: Compound Action Potential; GPIAS: Gap Prepulse Inhibition of the Acoustic Startle; i.m.: Intramuscular; i.p.: Intraperitoneal; PPI: Prepulse Inhibition; s.c.: Subcutaneous Injection
Introduction
The physiological processes underlying tinnitus, a phantom auditory perception, are still not well understood [1]. Although studies in humans provide vital clues regarding the network of neural structures involved and the relationship between specific features of tinnitus and altered brain activity [2,3], it is near impossible to study the cellular and molecular mechanism of tinnitus generation and maintenance in humans. Hence much of the research into mechanisms of tinnitus development is performed using animal models [1,4,5].
In animal models of tinnitus a variety of assessment paradigms have been used (for review see [5]). Earlier tinnitus models relied on behavioural assessment and training paradigms that were essentially based on an animal distinguishing silence from non-silence [6,7] but in 2006, Turner and co-workers proposed a paradigm that relied on an acoustic reflex [8]. The gap prepulse inhibition of the acoustic startle (GPIAS) test they proposed is a variant of the commonly used prepulse inhibition (PPI) of acoustic startle. In PPI an acoustic startle response (elicited by a brief, loud tone) is inhibited by a nonstartling prepulse, presented just before the acoustic startle tone [9]. The GPIAS utilizes a brief silent gap in an otherwise continuous background noise as the “prepulse” which results in inhibition of the acoustic startle response similar to PPI [10]. Animals with tinnitus show reduced inhibition in the GPIAS test when their tinnitus resembles the background noise and it has been suggested that this is due to the tinnitus “filling in” the gap [8,11,12], though this is still under debate [13]. Because GPIAS has been validated against behavioural tests of tinnitus in animals [8] and is a convenient tool to quickly screen animals, its use has become widespread amongst research groups investigating tinnitus [14]. Studies have shown that GPIAS can be used in rats [8,15,16], mice [17-20] and guinea pigs [11,21,22]. In addition, it has been used after a variety of tinnitus-inducing methods such as after salicylate or quinine [15,23] as well as after acoustic overexposure [16]. Specific parameters, such as the frequency of the background noise and intensity of the startle stimuli used by the different research groups, vary dependent on the natural audiograms of the species used and on the method used to induce tinnitus [15,16,24]. In addition, the timing of tinnitus development differs between the different studies though it is unclear whether this is due to species or strain differences or the variety of methods used to induce tinnitus.
In our laboratory we use guinea pig models to explore the neural substrate of tinnitus [21,22]. Before any tinnitus inducing treatment we always establish stable baseline suppression in the GPIAS and PPI test for each animal. The PPI test is conducted together with the GPIAS test as it establishes that the animal can hear both the prepulse and the background noise (we use background noise in the GPIAS test with the exact same characteristics as the prepulse in the PPI test). This is essential because an animal may show reduced suppression in the GPIAS test not only due to the presence of tinnitus, but also when it cannot hear the background noise and hence would be unable to detect a silent gap [11,21,22]. The guinea pigs used in our laboratory are derived from two tricolour outbred guinea pig colonies. Our data suggested that the animals from these colonies showed very different responses in the GPIAS and PPI test. One of the colonies showed robust PPI and GPIAS before any tinnitus inducing treatment whereas the other colony showed robust PPI but only occasionally robust GPIAS. We therefore collated data from animals from multiple experiments over a period of 18 months to further investigate this difference and determine whether any difference could be attributed to hearing loss or other factors in these colonies.
General Methods
Animals
The data from 90 adult pigmented guinea pigs (57 males and 33 females) weighing 200-250 g at the beginning of behavioural assessments were analysed. Data were taken from animals used in different experiments taking place in our laboratory over a period of approximately 18 months. Animals which showed good PPI and GPIAS (see section 2 for details) were used for tinnitus inducing experiments by acoustic trauma [22] and manuscript in preparation. The guinea pigs were derived from 2 different colonies bred at the University of Western Australia. 45 animals from colony 1 and 45 animals were taken from colony 2. Both colonies are tricolour, outbred strains. Nine of the animals (5 colony 2 and 4 colony 1 animals) were used to assess hidden hearing loss and did not undergo behavioural assessment. Experimental protocols complied with the Code of Practice of the National Health and Medical Research Council of Australia and were approved by the Animal Ethics Committee of the University of Western Australia.
Behavioural assessment: PPI and GPIAS
Behavioural assessments used in this study were PPI and GPIAS. In both assessments a loud startle pulse elicited a startle response measured via a force transducing platform. In PPI a weaker pre-stimulus (prepulse) inhibits the reaction to the stronger startle stimulus. GPIAS is a variation of PPI, utilising a gap in a continuous background noise instead of a prepulse.
Guinea pigs were tested in a sound proof room, in batches of four or less, and were not mixed with guinea pigs outside their initial testing group. Guinea pigs were mildly restrained in polycarbon animal holders which were placed on one of four custom made force transducing platforms. Each animal was always allocated to the same platform for all following experiments. Platforms were located in a cross like formation with the speakers placed just above the level of the animal holders in the centre and guinea pigs facing each other. The room was dark during experimentation and animals were allowed to acclimatize for five minutes before testing commenced. In order to minimise potential habituation bias, guinea pigs were never tested on consecutive days and never more than 3 days per week.
The PPI test consisted of 50 trials with a randomised duration of 20 to 30 seconds each. Each trial contained a narrow band startle stimulus presentation (1 kHz centre frequency, 0.5 kHz bandwidth; 106 dB SPL; 50 ms duration). Half of the trials [25] contained a prepulse (50 ms duration; starting 100 ms before startle stimulus presentation). Prepulses were presented as a narrowband noise centred at either 8 kHz (10 dB bandwidth 2.2 kHz) or 14 kHz (10 dB bandwidth 1.6 kHz). A single prepulse intensity was used for each test (66, 70 or 73 dB SPL). The remaining 25 trials were “no-prepulse” trials; trials presented with only the startle stimulus. The order of prepulse and no-prepulse trials was randomised. One speaker generated the startle stimulus (Radio Shack 401278B) and prepulses were generated by a separate speaker (Beyer DT 48).
The GPIAS test also consisted of 50 trials (randomised length 20 to 30s similar to PPI test). Each trial contained a startle stimulus presentation identical to the PPI test but which was embedded in a constant wideband background noise. The background noise characteristics (centred on either 8 kHz, 10 dB; bandwidth 2.2 kHz, or 14 kHz 10 dB; bandwidth 1.6 kHz) were identical to the prepulse characteristics in the PPI test. Half of the trials [25] contained a brief silent gap (50 ms duration) inserted in the background noise 100 ms before the startle stimulus presentation (“gap” trials). The other 25 trials had no gap in the background sound (“no gap” trials). The order of gap and no gap trials within the GPIAS session was randomised. The background noise was generated by the same speaker used to generated prepulses in the PPI test.
The startle responses generated by the animals during the PPI and GPIAS tests were recorded by a force transducer and processed by custom written software in LabView (N. Yates) to calculate acoustic startle response as the ratio between the root mean square (RMS) of the force produced during the startle response and the RMS of baseline force for each trial. The first 4/50 trials were not included to avoid habituation bias.
Surgery for CAP audiogram and input-output functions
Because the animals described in this paper were used in different experiments, measurement of CAP audiograms took place under anaesthesia either with a protocol that allowed recovery or a non-recovery anaesthetic protocol. All CAP audiograms were measured after the PPI and GPIAS testings were finalized. Recovery protocol: Animals received a subcutaneous injection (s.c.) with 0.1 mL atropine (0.6 mg/ml), followed by an intraperitoneal injection (i.p.) with diazepam (Pamlin, 5 mg/kg). After twenty minutes, Hypnorm (1 ml/kg; 0.315 mg/mL fentanyl citrate and 10 mg/mL fluanisone) was administered by intramuscular injection (i.m.). Lignocaine s.c. (20 mg/ml) was used as local anaesthetic at incision site. Non-recovery protocol: Animals were anaesthetised by s.c. administration of 0.1 ml atropine (0.65 mg/ml Atropine sulphate), followed by an i.p. injection of 30 mg/kg of sodium pentobarbitone and 10 minutes later, an i.m. injection of 0.15 ml of Hypnorm (0.135 mg/ml Fentanyl citrate, 10 mg/ml Fluanisone) was administered. Lignocaine was administered s.c. to the incision areas. Once full anaesthesia was obtained as assessed using the foot withdrawal reflex, animals were placed on a heated platform with blanket in a soundproof room. The non-recovery anaesthesia protocol is followed by a tracheotomy and the animals artificially ventilated on carbogen (95% O2, 5% CO2).
For surgery animals were mounted between hollow ear bars and the bulla was exposed. A small opening was made in the bulla to enable placement of an insulated silver wire onto the round window to record a compound action potential (CAP) audiogram for frequencies ranging from 4 to 24 kHz as performed routinely in our laboratory [25-27]. Sound stimuli were presented in a calibrated closed sound system through a ½” condenser microphone driven in reverse as a speaker (Bruel and Kjaer, type 4134). Pure tone stimuli (10 ms duration, 1 ms rise/fall times) were synthesized by a computer equipped with a DIGI 96 soundcard connected to an analog/digital interface (ADI-9 DS, RME Intelligent Audio Solution). Sample rate was 96 kHz. The interface was driven by a custom-made computer program (Neurosound, MI Lloyd). CAP signals were amplified (1000x), filtered (100 Hz-3 kHz bandpass) and recorded with a second data acquisition system (Powerlab 4SP, AD Instruments).
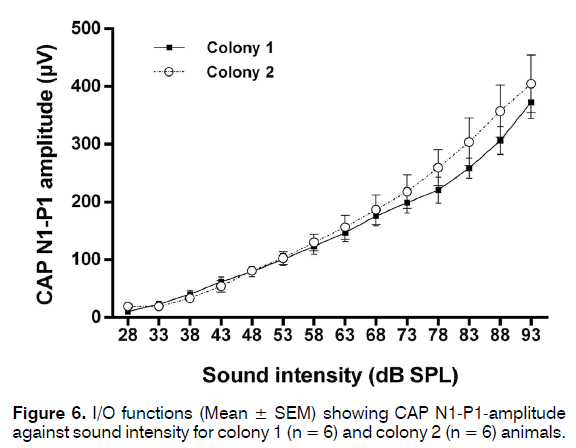
In 9 of the animals (5 colony 1 and 4 colony 2 animals) detailed input-output (I/O) functions were recorded at 20 kHz at 5 dB intensity increments. Averaged waveforms (32 presentations) were recorded using a 40 kHz sampling rate (AD Instruments Powerlab 4ST and Scope software) and amplitudes were analysed off-line. CAP amplitudes were measured as the N1-P1 peak-topeak amplitude.
Analysis
The startle response ratios were compared between the two trial conditions (gap vs. no-gap for GPIAS tests and prepulse vs. no-prepulse for PPI tests) in each test using a Mann Whitney U test. A statistically significant difference (p < 0.05) between trial conditions indicated a “pass” for that test. The animal was deemed to have failed the test when there was no significant difference between the gap and no gap condition (GPIAS test) or between the prepulse and no prepulse conditions (PPI test) (p>0.05). For each test the average “suppression” of the startle reflex caused by the pre-startle gap (or prepulse) was calculated and converted to a percentage. To compare the overall percentages of animals passing and failing GPIAS and PPI tests from each colony a Fisher exact test was used. To test for statistically significant differences in GPIAS and PPI acoustic startle reflex percentage suppression a one-way ANOVA with a Sidak’s multiple comparisons test was used. To investigate whether startle reflex suppression differences were due to differing characteristics of the force transducing platforms, baseline responses (i.e. no gap trials/no prepulse trials) were compared across platform and colonies using a two-way ANOVA with Holm Sidak’s multiple comparisons post hoc tests. In order to compare CAP audiograms between colonies, a two-way ANOVA with Sidak’s multiple comparisons post hoc tests was used.
Results
PPI and GPIAS tests
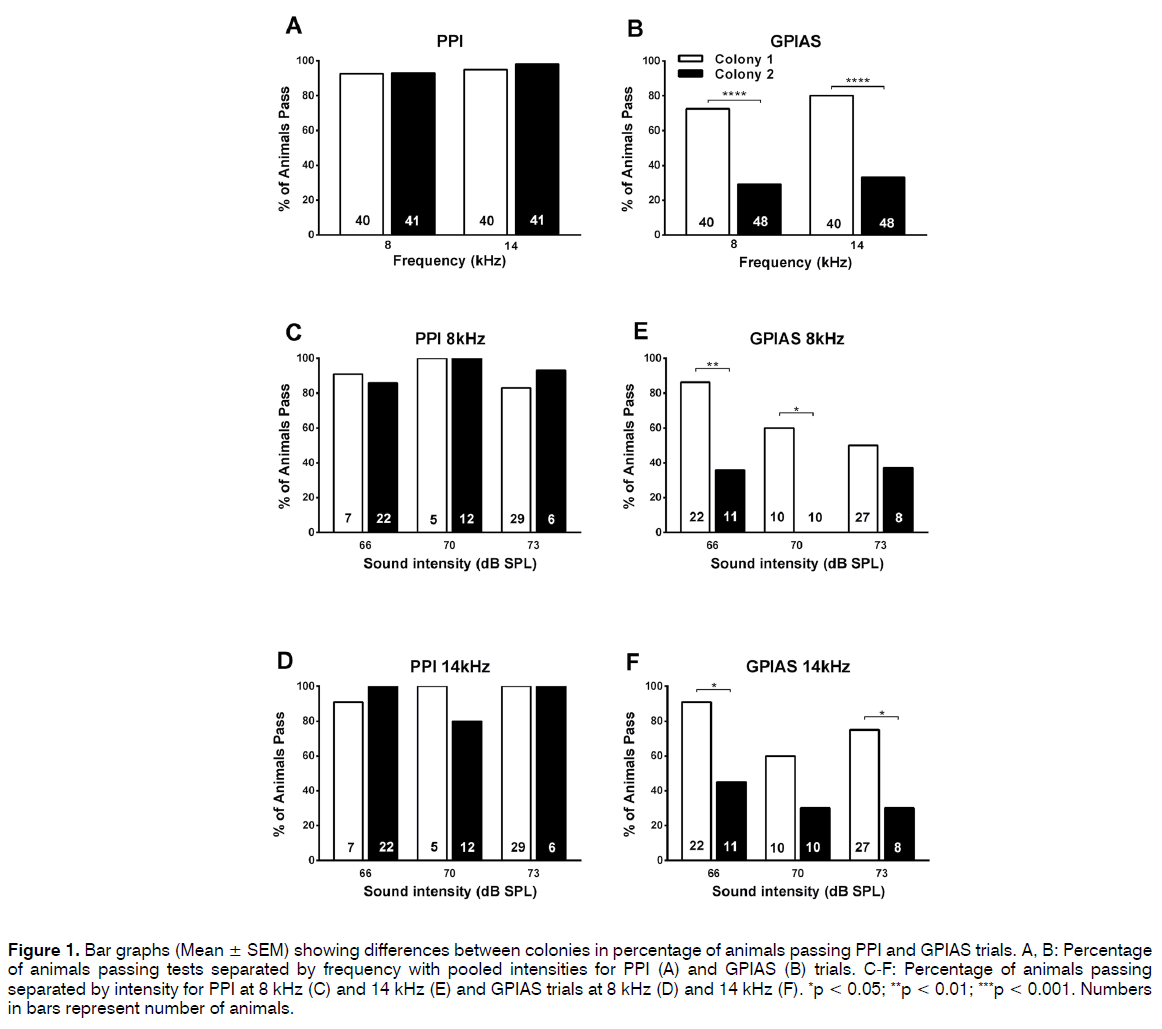
Figure 1A shows that the percentage of animals passing the PPI test (showing a significant difference i.e. p < 0.05 between no-prepulse and prepulse trials) was very similar in the 2 colonies at both the prepulse frequencies.
Figure 1: Bar graphs (Mean ± SEM) showing differences between colonies in percentage of animals passing PPI and GPIAS trials. A, B: Percentage of animals passing tests separated by frequency with pooled intensities for PPI (A) and GPIAS (B) trials. C-F: Percentage of animals passing separated by intensity for PPI at 8 kHz (C) and 14 kHz (E) and GPIAS trials at 8 kHz (D) and 14 kHz (F). *p < 0.05; **p < 0.01; ***p < 0.001. Numbers in bars represent number of animals.
Thirty-seven of the 40 colony 1 animals (92.5%) passed at 8 kHz and 38 animals (95%) at 14 kHz. Results were very similar in colony 2 with 39 of the 41 animals (95.1%) passing at 8 kHz and 40 (97.6%) at 14 kHz.
Figure 1B shows that this was very different when the animals were tested in the GPIAS test. Although the majority of animals from colony 1 also passed the GPIAS test this was not the case for the colony 2 animals. Thirtyone of the colony 1 animals (77.5%) passed at 8 kHz and 36 animals (90%) at 14 kHz, but only 12 (29.2%) and 13 (31.7%) of the 41 colony 2 animals passed at 8 kHz and 14 kHz, respectively. A two-sided Fisher’s exact test was used to compare the percentage of animals passing at either frequency in the PPI and GPIAS test and this revealed no significant differences in the PPI test but in the GPIAS test a significantly higher proportion of colony 1 animals passed both at 8 kHz (p < 0.0001, Fishers exact test) and at 14 kHz (p < 0.0001, Fisher’s exact test) compared to colony 2 animals.
It was then further investigated whether the pass/ fail ratios in the GPIAS test were affected by the intensity of the background noise as this could have been a confounding factor in the pooled data shown in Figures 1A and 1B. Results of comparisons of the different intensity levels used in our tests at 8 kHz and 14 kHz are shown in Figures 1C-1F. The same trends as observed in the pooled data were visible when data were separated according to the intensity of the background noise or prepulse. Percentages of animals passing the PPI test were fairly similar between the 2 colonies (Figures 1C and 1D) independent of the intensity level of the prepulse and varied between 80 and 100% for both colony 1 and 2 animals. However, percentages of animals passing the GPIAS test were consistently lower in the colony 2 animals (Figures 1E and 1F) (50% and 91% in the colony 1 animals and between 0% and 45% in the colony 2 animals). In addition, there seemed to be a small effect of intensity for colony 1 as the percentage of animals passing the tests seemed to be inversely related to the intensity of the background noise or prepulse, and this effect was especially visible at 8 kHz. A two-sided Fisher’s exact test was used to compare the percentage of animals passing at either frequency at various intensities in the PPI and GPIAS test and this revealed no significant differences in the PPI test, the 8 kHz GPIAS test at an intensity level of 73 dB or the 14 kHz GPIAS test at an intensity of 70 dB.
However, a significant difference was observed between colony 1 compared to colony 2 in the animals passing the GPIAS test for 8 kHz at intensity levels of 66 dB (p =0.0059, Fishers exact test) and 70 dB (p = 0.0108, Fishers exact test) and for 14 kHz at 66 dB (p = 0.0294, Fisher’s exact test) and 73 dB (p = 0.0386, Fishers exact test).
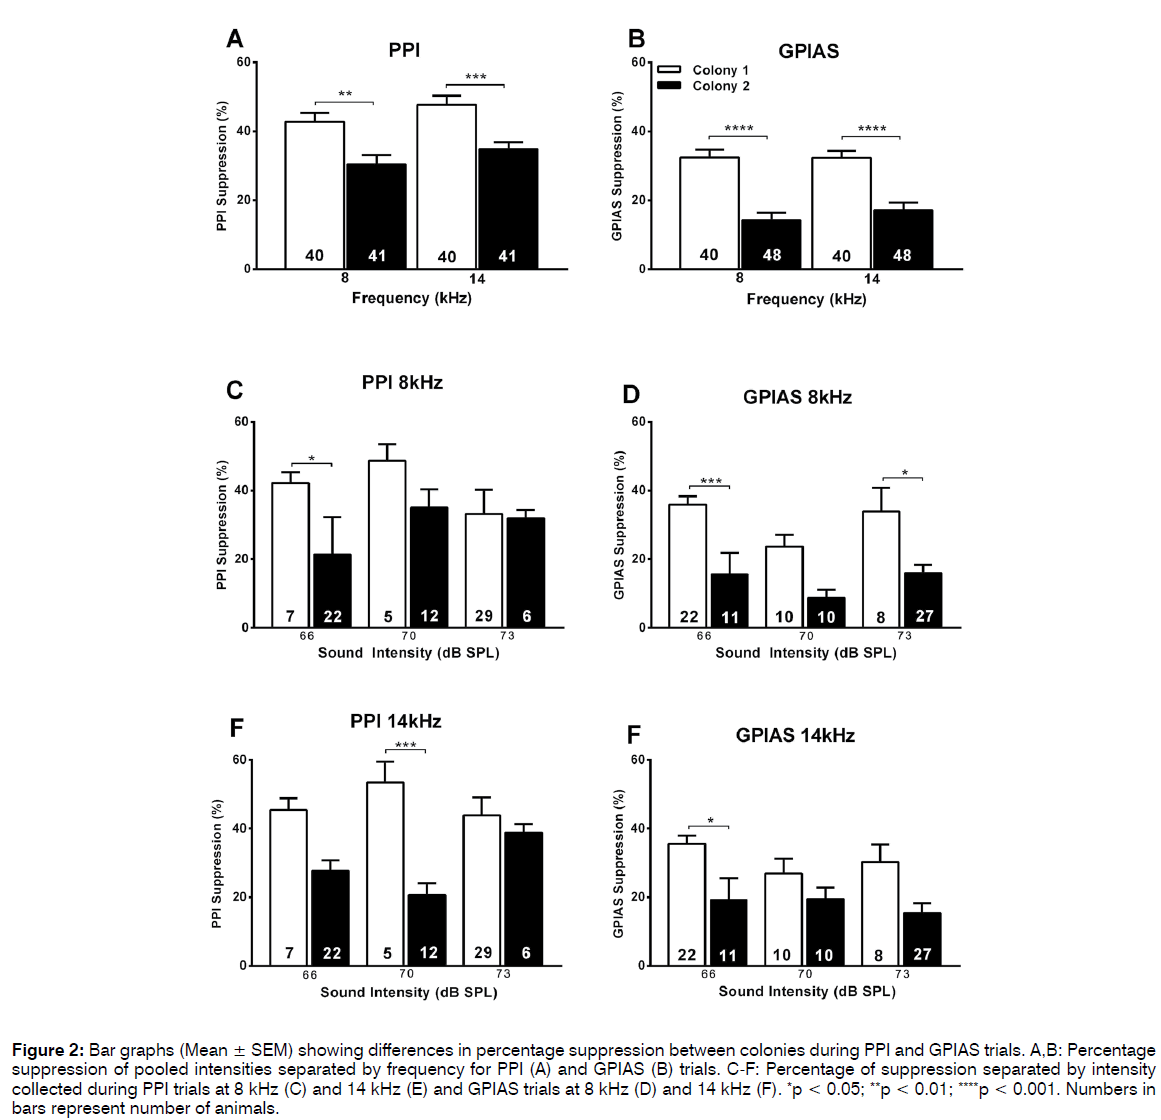
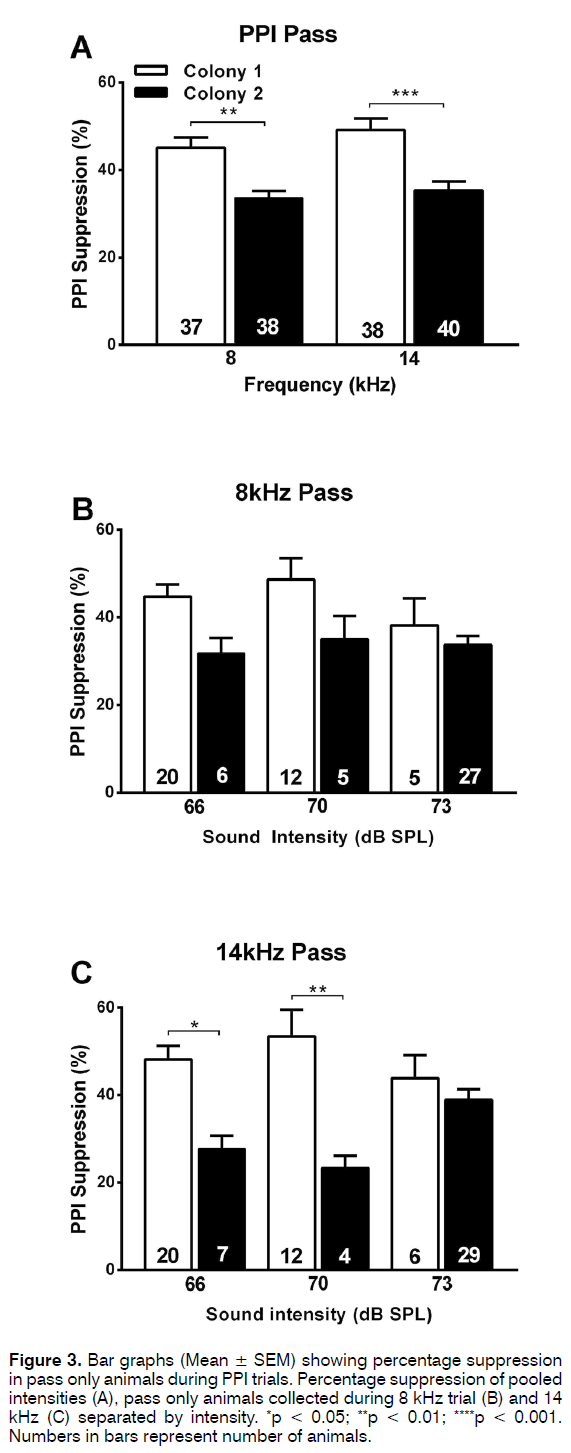
Although the ratios of animals passing or failing the PPI test were similar between the 2 colonies, it was investigated whether the percentage inhibition was different. Using pooled data from different intensities of the prepulse, one-way ANOVA Sidak’s multiple comparisons post test showed that the percentage suppression was significantly lower (p < 0.001) in colony 2 (30-35%) as compared to colony 1 (43-48%) both with the 8 kHz or 14 kHz prepulse (Figure 2A). This was the case when all animals of each colony were included in the analysis (Figure 2A) but also when only the “passing” animals from both colonies were compared (Figure 3A). Therefore, even though the prepulse has a significant inhibitory effect in the majority of animals in both colonies (Figure 1A), the effect size differed between the colonies. This reduced effect size in the PPI test in colony 2 animals could also be observed when the data were separated according to intensity of the prepulse at the lower intensities used (66 and 70 dB SPL) but not at the higher intensity (73 dB SPL) (Figures 2C and 2D, 3C and 3D). Note that this trend was observed both when analysing all animals (Figure 2) or only the “passing” animals (Figure 3).
Figure 2: Bar graphs (Mean ± SEM) showing differences in percentage suppression between colonies during PPI and GPIAS trials. A,B: Percentage suppression of pooled intensities separated by frequency for PPI (A) and GPIAS (B) trials. C-F: Percentage of suppression separated by intensity collected during PPI trials at 8 kHz (C) and 14 kHz (E) and GPIAS trials at 8 kHz (D) and 14 kHz (F). *p < 0.05; **p < 0.01; ****p < 0.001. Numbers in bars represent number of animals.
Figure 3. Bar graphs (Mean ± SEM) showing percentage suppression in pass only animals during PPI trials. Percentage suppression of pooled intensities (A), pass only animals collected during 8 kHz trial (B) and 14 kHz (C) separated by intensity. *p < 0.05; **p < 0.01; ****p < 0.001. Numbers in bars represent number of animals.
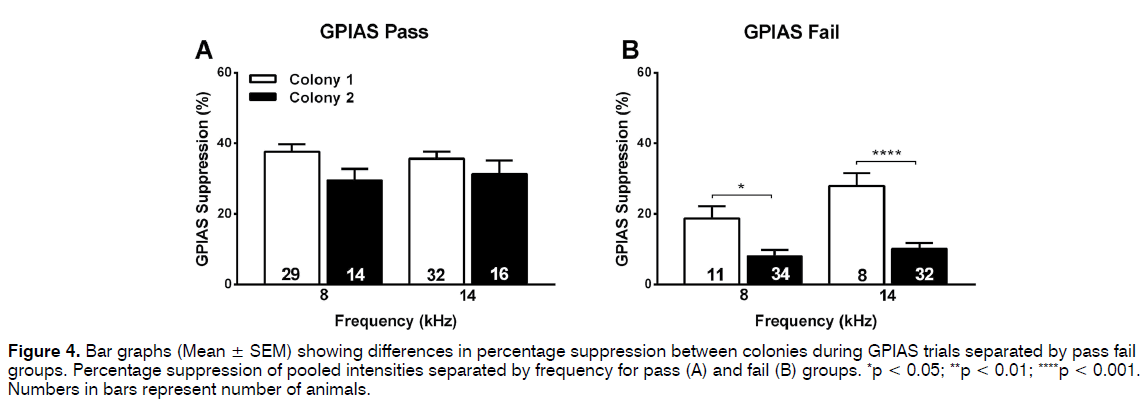
Similar analyses were then performed for the percentage suppression in the GPIAS test. When all animals and data points (some animals were tested at multiple intensities of the background noise) were included in the analysis the suppression was significantly less (p < 0.001) in the colony 2 animals (14- 17%) compared to the colony 1 animals (32%) at both frequencies of background noise (Figure 2B). This trend remained evident at all intensities of the background noise when data were separated according to intensity (Figures 2E and F), although this did not always reach significance possibly as a result of the lower group sizes. When the groups were separated into pass and fail animals in the GPIAS test, one-way ANOVA analysis revealed no difference in GPIAS suppression between the colonies for the passing animals (Figure 4A) but a significant decreased suppression at both 8 kHz (p = 0.0413) and 14 kHz (p < 0.001) in the failing colony 1 animals compared to the failed colony 2 animals (Figure 4B). Animals were not further subdivided according to the different levels of intensity of background noise used as group numbers were too small for a meaningful analysis.
Figure 4: Bar graphs (Mean ± SEM) showing differences in percentage suppression between colonies during GPIAS trials separated by pass fail groups. Percentage suppression of pooled intensities separated by frequency for pass (A) and fail (B) groups. *p < 0.05; **p < 0.01; ****p < 0.001. Numbers in bars represent number of animals.
CAP audiograms and I/O functions
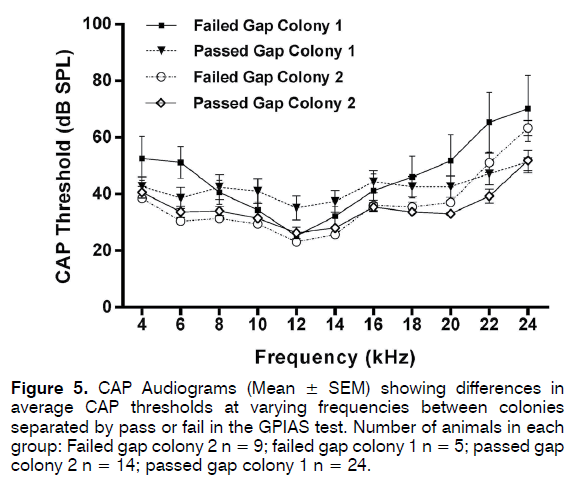
Bilateral CAP audiograms were collected from 24 animals from colony 1 which passed GPIAS and 5 that failed GPIAS and from 14 animals from colony 2 that passed GPIAS and 9 that failed GPIAS. From each animal the audiogram with the worst (highest) thresholds was selected for further analysis. This was done to ensure that even a unilateral hearing loss would be detected in analysis. Mean CAP threshold audiograms are shown in Figure 5. Although CAP audiograms of the colony 2 animals seemed to show overall somewhat lower thresholds and less variability than colony 1 animals, a two-way ANOVA followed by Sidak’s multiple comparisons showed no significant differences at any frequency between the colonies or between the animals within each colony that either passed or failed the GPIAS test. CAP I/O functions measured at 20 kHz from 5 colony 1 and 4 colony 2 animals are shown in Figure 6 and these revealed no differences at supra-threshold levels. Therefore, none of the colonies showed evidence of hidden hearing loss.
Figure 5: CAP Audiograms (Mean ± SEM) showing differences in average CAP thresholds at varying frequencies between colonies separated by pass or fail in the GPIAS test. Number of animals in each group: Failed gap colony 2 n = 9; failed gap colony 1 n = 5; passed gap colony 2 n = 14; passed gap colony 1 n = 24.
Discussion
The data in the present paper clearly demonstrate that seemingly similar strains of outbred guinea pigs can show very different baseline results in the GPIAS test even though they perform similarly in the PPI test. Almost all animals from both colonies showed significant suppression in the PPI test (described as pass PPI) and the number of animals passing PPI was independent of the frequency of the prepulse (8 or 14 kHz centred bandpass noise) or the intensity of the prepulse. However, the percentage of animals showing significant suppression in the GPIAS test (described as pass GPIAS) was significantly lower in colony 2 compared to colony 1.
One possible explanation for the results is that a large proportion of animals in colony 2 have pre-existing idiopathic tinnitus as a passed PPI with a failed GPIAS result is the criterion generally applied to identify the presence of tinnitus in animal models [8,11,21,22]. However, we consider this to be unlikely for several reasons. First, a major risk factor for the development of tinnitus is hearing loss1, [28-31] and we could not detect any sign of hearing damage in colony 2 compared to colony 1. Peripheral hearing thresholds measured by recordings of the compound action potential directly from the round window showed no differences between the colonies or, even more telling, between animals that passed or failed the GPIAS test. Secondly, no relationship could be found between absolute startle size and animals passing or failing GPIAS. An elevation of the startle response could suggest the presence of hyperacusis, an increased sensitivity to sound, which would also have been suggestive of some hearing damage [16,32]. Another possibility is that the animals could have hidden hearing loss which would show up as no change in auditory thresholds but instead as a decreased response at supra-threshold sounds. This may indicate some specific loss of the low spontaneous rate, high threshold auditory nerve fibres and could lead to tinnitus [33-36]. However, a comparison of the CAP inputoutput function at 20 kHz revealed no difference between the two colonies, revealing no signs of a hidden hearing loss.
An alternative explanation for our data is that although a prepulse and a gap both inhibit the startle response, they do so via different circuitry. Circuitry involved in PPI and GPIAS is actually a combination of acoustic startle response circuitry and pathways responsible for inhibition of the acoustic startle response37, which may differ between the two tests. Previous studies have shown that different strains of laboratory animals can show distinct differences in acoustic startle response and PPI [37,38]. In addition, several studies provide evidence that the neural circuitry underlying PPI and GPIAS is not identical, for example showing involvement of auditory cortex in the inhibitory effects in GPIAS but not in PPI [39-41]. However, as the complete neuronal circuitry underlying GPIAS has yet to be elucidated in contrast to PPI circuitry [37], exactly which elements are different in the colony 2 animals cannot be determined at present. In addition, as the percentage inhibition in the PPI was smaller in colony 2, even in the animals that passed PPI, it is likely that there are also some differences in the common circuitry of PPI and GPIAS between the colonies described in this paper. Previous studies describing differences in PPI or acoustic startle circuitry within animals or humans show this may be associated with differences in dopaminergic systems [37,42,43].
The present paper is not the first to show that GPIAS testing protocols have to be applied with appropriate controls and may require optimization in order to provide a robust tool to detect tinnitus in animals (for example see [24]). PPI is required alongside GPIAS testing to ensure that the animal can still hear the background noise/ prepulse after any treatment causing a hearing loss [11,16,22]. In addition, caution is necessary when interpreting the outcome parameters. It has been shown that the absolute startle size can vary after hearing loss, which can potentially affect outcomes [18,44]. Therefore, it has been suggested by Lobarinas and colleagues that the startle stimulus could be replaced by a non-auditory stimulus such as an airpuff stimulus44, which is also used in human studies using PPI [45], or that statistical comparison should be performed not only on gap suppression but also on the absolute startle amplitudes [44]. It should be noted that absolute startle stimulus was not a confounding factor in our data as no significant differences were detected between the two colonies.
Some limitations of the present study include the fact that the data were obtained retrospectively from animals used for a number of studies in our laboratory and this was not a prospective study. Hence, some of the group sizes, especially once animals were separated into different intensities used for the prepulse or background noise, were not homogenous and in some instances group size was relatively small. In addition, CAP audiograms were not obtained for all animals described. Nonetheless, our data strongly suggest that establishing stable baseline data is paramount when selecting animals for tinnitus models when using the GPIAS test to establish the presence of tinnitus. The GPIAS test, though fast and convenient may not be suitable to be used in all animals. However, further prospective studies using a larger group size for all parameters explored should be conducted in a range of animal species and strains to investigate whether the results described in our guinea pig colonies can be replicated and can be observed in all laboratory animal species used in tinnitus research.
Acknowledgments
This work was supported by grants from the Medical Health and Research Infrastructure Fund and funds provided by the School of Human Sciences UWA.
References
- Eggermont JJ, Roberts LE. Tinnitus: Animal models and findings in humans. Cell Tissue Res. 2015;361(1):311-36.
- Leaver AM, Turesky TK, Seydell-Greenwald A, Morgan S, Kim HJ, Rauschecker JP. Intrinsic network activity in tinnitus investigated using functional MRI. Hum Brain Mapp. 2016;37(8):2717-35.
- Husain FT. Neural networks of tinnitus in humans: Elucidating severity and habituation. Hear Res. 2016;334:37-48.
- Eggermont JJ. Can Animal Models Contribute to Understanding Tinnitus Heterogeneity in Humans? Front Aging Neurosci. 2016;8:265.
- Brozoski TJ, Bauer CA. Animal models of tinnitus. Hear Res. 2016;338:88-97.
- Jastreboff PJ, Brennan JF, Coleman JK, Sasaki CT. Phantom auditory sensation in rats: An animal model for tinnitus. Behav Neurosci. 1988;102(6):811-22.
- Bauer CA, Brozoski TJ. Assessing tinnitus and prospective tinnitus therapeutics using a psychophysical animal model. J Assoc Res Otolaryngol. 2001;2(1):54-64.
- Turner JG, Brozoski TJ, Bauer CA, Parrish JL, Myers K, Hughes LF, et al. Gap detection deficits in rats with tinnitus: A potential novel screening tool. Behav Neurosci. 2006;120(1):188-95.
- Hoffman HS, Ison JR. Reflex modification in the domain of startle: I. Some empirical findings and their implications for how the nervous system processes sensory input. Psychol Rev. 1980;87(2):175-89.
- Moreno-Paublete R, Canlon B, Cederroth CR. Differential Neural Responses Underlying the Inhibition of the Startle Response by Pre-Pulses or Gaps in Mice. Front Cell Neurosci. 2017;11.
- Dehmel S, Eisinger D, Shore SE. Gap prepulse inhibition and auditory brainstem-evoked potentials as objective measures for tinnitus in guinea pigs. Front Syst Neurosci. 2012;6:42.
- Robertson D, Bester C, Vogler D, Mulders WH. Spontaneous hyperactivity in the auditory midbrain: Relationship to afferent input. Hear Res. 2013;295:124-9.
- Campolo J, Lobarinas E, Salvi R. Does tinnitus "fill in" the silent gaps? Noise Health. 2013;15(67):398-405.
- Galazyuk A, Hebert S. Gap-Prepulse Inhibition of the Acoustic Startle Reflex (GPIAS) for Tinnitus Assessment: Current Status and Future Directions. Frontiers in neurology. 2015;6:88.
- Ralli M, Lobarinas E, Fetoni AR, Stolzberg D, Paludetti G, Salvi R. Comparison of salicylate- and quinine-induced tinnitus in rats: Development, time course, and evaluation of audiologic correlates. Otol Neurotol. 2010;31(5):823-31.
- Turner JG, Larsen D. Effects of noise exposure on development of tinnitus and hyperacusis: Prevalence rates 12 months after exposure in middle-aged rats. Hear Res. 2016;334:30-6.
- Longenecker RJ, Chonko KT, Maricich SM, Galazyuk AV. Age effects on tinnitus and hearing loss in CBA/CaJ mice following sound exposure. SpringerPlus. 2014;3:542.
- Longenecker RJ, Galazyuk AV. Development of tinnitus in CBA/CaJ mice following sound exposure. J Assoc Res Otolaryngol. 2011;12(5):647-58.
- Longenecker RJ, Galazyuk AV. Variable Effects of Acoustic Trauma on Behavioral and Neural Correlates of Tinnitus In Individual Animals. Front Behav Neurosci. 2016;10:207.
- Turner J, Larsen D, Hughes L, Moechars D, Shore S. Time course of tinnitus development following noise exposure in mice. J Neurosci Res. 2012;90(7):1480-8.
- Mulders WH, Barry KM, Robertson D. Effects of furosemide on cochlear neural activity, central hyperactivity and behavioural tinnitus after cochlear trauma in guinea pig. PloS one. 2014;9(5):e97948.
- Mulders WHAM, Vooys V, Makowiecki K, Tang A, Rodger J. The effects of repetitive transcranial magnetic stimulation in an animal model of tinnitus. Sci Rep. 2016;6:38234.
- Yu H, Vikhe Patil K, Han C, Fabella B, Canlon B, Someya S, et al. GLAST Deficiency in Mice Exacerbates Gap Detection Deficits in a Model of Salicylate-Induced Tinnitus. Front Behav Neurosci. 2016;10:158.
- Longenecker RJ, Galazyuk AV. Methodological optimization of tinnitus assessment using prepulse inhibition of the acoustic startle reflex. Brain Res. 2012;1485:54-62.
- Johnstone JR, Alder VA, Johnstone BM, Robertson D, Yates GK. Cochlear action potential threshold and single unit thresholds. J Acoust Soc Am. 1979;65(1):254-7.
- Mulders WH, Ding D, Salvi R, Robertson D. Relationship between auditory thresholds, central spontaneous activity, and hair cell loss after acoustic trauma. J Comp Neurol. 2011;519(13):2637-47.
- Mulders WH, Robertson D. Hyperactivity in the auditory midbrain after acoustic trauma: Dependence on cochlear activity. Neuroscience. 2009;164(2):733-46.
- Canlon B, Henderson D, Salvi R. Pharmacological Strategies for Prevention and Treatment of Hearing Loss and Tinnitus. Hear Res. 2007;226(1-2):1-2.
- Konig O, Schaette R, Kempter R, Gross M. Course of hearing loss and occurrence of tinnitus. Hear Res. 2006;221(1-2):59-64.
- Moore BC, Vinay, Sandhya. The relationship between tinnitus pitch and the edge frequency of the audiogram in individuals with hearing impairment and tonal tinnitus. Hear Res. 2010;261(1-2):51-6.
- Norena A, Micheyl C, Chery-Croze S, Collet L. Psychoacoustic characterization of the tinnitus spectrum: Implications for the underlying mechanisms of tinnitus. Audiol Neurootol. 2002;7(6):358-69.
- Salloum RH, Sandridge S, Patton DJ, Stillitano G, Dawson G, Niforatos J, et al. Untangling the effects of tinnitus and hypersensitivity to sound (hyperacusis) in the gap detection test. Hear Res. 2016;331:92-100.
- Furman AC, Kujawa SG, Liberman MC. Noise-induced cochlear neuropathy is selective for fibers with low spontaneous rates. J Neurophysiol. 2013;110(3):577-86.
- Liberman MC. Hidden Hearing Loss. Scientific American. 2015;313(2):48-53.
- Kujawa SG, Liberman MC. Adding insult to injury: Cochlear nerve degeneration after "temporary" noise-induced hearing loss. J Neurosci. 2009;29(45):14077-85.
- Liberman MC. Noise-Induced Hearing Loss: Permanent Versus Temporary Threshold Shifts and the Effects of Hair Cell Versus Neuronal Degeneration. Advances in experimental medicine and biology. 2016;875:1-7.
- Swerdlow NR, Braff DL, Geyer MA. Cross-species studies of sensorimotor gating of the startle reflex. Ann N Y Acad Sci. 1999;877:202-16.
- Paylor R, Crawley JN. Inbred strain differences in prepulse inhibition of the mouse startle response. Psychopharmacology. 1997;132(2):169-80.
- Moreno-Paublete R, Canlon B, Cederroth CR. Differential Neural Responses Underlying the Inhibition of the Startle Response by Pre-Pulses or Gaps in Mice. Front Cell Neurosci. 2017;11:19.
- Ison JR, O'Connor K, Bowen GP, Bocirnea A. Temporal resolution of gaps in noise by the rat is lost with functional decortication. Behav Neurosci. 1991;105(1):33-40.
- Bowen GP, Lin D, Taylor MK, Ison JR. Auditory cortex lesions in the rat impair both temporal acuity and noise increment thresholds, revealing a common neural substrate. Cereb Cortex. 2003;13(8):815-22.
- Schellekens AF, Grootens KP, Neef C, Movig KL, Buitelaar JK, Ellenbroek B, et al. Effect of apomorphine on cognitive performance and sensorimotor gating in humans. Psychopharmacology. 2010;207(4):559-69.
- Yates NJ, Martin-Iverson MT, Rodger J. The role of ephrin-A2 and ephrin-A5 in sensorimotor control and gating. Behavioural brain research. 2014;275:225-33.
- Lobarinas E, Hayes SH, Allman BL. The gap-startle paradigm for tinnitus screening in animal models: Limitations and optimization. Hear Res. 2013;295:150-60.
- Flaten MA, Nordmark E, Elden A. Effects of background noise on the human startle reflex and prepulse inhibition. Psychophysiology. 2005;42(3):298-305.
References
1School of Human Sciences, University of Western Australia, Crawley, Western Australia, Australia
2Ear Science Institute Australia, Subiaco, Western Australia, Australia
Send correspondence to:
Mulders WHAM
School of Human Sciences, University of Western Australia, 35 Stirling Highway, Crawley, Western Australia, 6009, Australia. E-mail: helmy.mulders@uwa.edu.au
Paper submitted to the ITJ-EM (Editorial Manager System) on January 21, 2018; and accepted on February 13, 2018.
Citation: Leggett K, Mendis V, Mulders WHAM. Divergent Responses in the Gap Prepulse Inhibition of the Acoustic Startle Reflex in Two Different Guinea Pig Colonies. Int Tinnitus J. 2018;22(1):1-9


