The International Tinnitus Journal
Official Journal of the Neurootological and Equilibriometric Society
Official Journal of the Brazil Federal District Otorhinolaryngologist Society
ISSN: 0946-5448

Google scholar citation report
Citations : 12717
The International Tinnitus Journal received 12717 citations as per google scholar report
The International Tinnitus Journal peer review process verified at publons
Indexed In
- Excerpta Medica
- Scimago
- SCOPUS
- Publons
- EMBASE
- Google Scholar
- Euro Pub
- CAS Source Index (CASSI)
- Index Medicus
- Medline
- PubMed
- UGC
- EBSCO
Volume 26, Issue 2 / December 2022
Research Article Pages:79-88
10.5935/0946-5448.20220012
Exploring the Effect of Silence on Auditory Network Regions in Young Female Adults who Experience Temporary Tinnitus on Exposure to Silence
Authors: Ukaegbe Onyinyechi
PDF
Abstract
Objectives: To examine the differences in auditory evoked cortical responses that may underlie the tendency of some people to perceive tinnitus. The study hypothesis is that the mean ALR and P300 amplitudes in normal hearing adults who perceive temporary tinnitus after exposure to sustained silence will be larger than the mean ALR and P300 amplitudes in normal hearing adults who do not perceive temporary tinnitus after exposure to sustained silence.
Design: This was a prospective cross-sectional study. The approval for the study was obtained from the IRB and COVID ramp up committee of University of North Carolina Greensboro (UNCG). Participants completed comprehensive hearing screening and pre- and post- silence ALR and P300 recordings were obtained. After the first ALR/P300 recording participants were exposed to ten minutes of silence. Participants completed a Qualtrics questionnaire to report any tinnitus perception that emerged during silence exposure. Absolute N1, P2 and P300 waveform amplitudes and latencies were identified and were entered into an SPSS spreadsheet for data analysis.
Results: Thirty adult females with normal pure tone hearing thresholds and no history of persistent tinnitus were included in the study. The mean age of the participants was 22.5 ± 3.9 years. When exposed to silence, eight (26.7%) participants perceived temporary tinnitus. N1 and P300 waveforms were smaller in amplitude and faster in latency in the tinnitus perception group; however, the ALR and P300 waveform latencies and amplitudes did not statistically differ significantly between the participants who perceived temporary tinnitus in silence and those who did not (p>0.05). The difference in waveform morphology between the tinnitus perception group and the non-tinnitus perception group revealed a greater difference in P300 amplitude after exposure to silence.
Conclusion: Differences in ALR and P300 latencies and amplitudes were observed between the tinnitus perception group and non-tinnitus perception group, with smaller P300 amplitudes appearing in the group perceiving tinnitus. While the results did not statistically significant, this pattern may reflect a mismatch between the neuronal response in the auditory cortex (N1 and P2 amplitudes and latencies) and the neuronal activity in the modulatory network regions (P300).
Keywords: Tinnitus, Silence, Auditory late response, P300, Auditory evoked response.
Introduction
Tinnitus is often reported as the perception of sound in the ears or the head in the absence of an external stimulus and this perception can be unilateral or bilateral [1]. The worldwide prevalence of tinnitus varies from 5.1% to 42.7% of the adult populations. It is estimated that one quarter (25.3%) of American adults are likely to be experiencing tinnitus at any point in time and that it is persistent in 7.9% of individuals [2, 3]. The Center for Disease Control (CDC) estimates that one out of every ten Americans experiences tinnitus. Similarly, National Health and Nutrition Examination Survey which ran from 2005–2008 estimated that 2.5 million youths aged 12–19 years reported having tinnitus [4, 5]. The mechanisms behind tinnitus generation are not fully understood, but tinnitus is believed to be the result of a complex set of events set in motion by a reduction in auditory stimulation which leads to the downregulation of auditory neuronal inhibition, a redistribution of glutamate receptors on the auditory neurons, an increase in burst firing and an increase in spontaneous firing rate which are all part of an increase in central gain which is subsequently perceived as tinnitus [6, 7]. It has been postulated that following the increased gain seen in an effort to achieve homeostasis in the auditory pathway, a breakdown in the control of the perception of this gain as tinnitus occurs in some non-auditory cortical regions and results in persistent attention to the sensation generated by the increase in auditory gain [8]. Widespread changes in neuronal activation and connectivity have been observed in correlation with tinnitus perception and extend to the thalamus, limbic system, frontal cortex, parietal cortex and the parahippocampal region [8-11]. Even though the exact nature of the breakdown in the auditory network is still being investigated, the network theory may account for the variance in the response to tinnitus and why some people find it more disturbing than others.
Silence has been reported to increase tinnitus perception and awareness in people with chronic tinnitus. Also, it appears that most adults with no prior history of tinnitus or ear pathology report the perception of temporary tinnitus when exposed to sustained silence [12-14]. This may be attributed to the unmasking of sounds that were previously masked by the environment or it may be a reflection of functional changes in the auditory system following a period of reduced auditory stimulation [15]. Studying the perception of tinnitus in silence could improve our understanding of why it is present in some people and absent in others with similar thresholds. One method used in studying neural activity in tinnitus is by recording Auditory Evoked Responses (AERs).
AER waveforms represent a manifestation of intracortical currents generated by excitatory and inhibitory postsynaptic potentials [16]. There is a paucity of data on the Auditory Late Responses (ALRs) and P300 waveform patterns in normal hearing people without tinnitus who tend to perceive tinnitus when exposed to silence, but a few studies have looked at ALR and P300 waveform patterns in subjects experiencing chronic tinnitus. The existing literature on ALRs in tinnitus has been variable with conflicting reports. Some studies have reported the participants experiencing tinnitus had longer N1, P2 and P300 waveform latencies [17, 18]. However, other studies have reported no difference in ALR latencies between subjects perceiving tinnitus and those who do not but there was a difference in amplitude reported with tinnitus perception [19]. Although some authors observed higher mean N1-P2 amplitudes in people with tinnitus, others report decreased N1, P2 and P300 amplitudes relative to controls without a history of chronic tinnitus [18, 19]. Many of the studies made use of participants with chronic tinnitus and hearing loss; therefore, the changes in cortical activity reported in these studies may not be wholly attributed to tinnitus but also to hearing loss and compensatory changes following chronic tinnitus. Furthermore, imaging studies in tinnitus subjects imply that there is altered functional connectivity between the auditory cortical regions and regions of the brain involved in the regulation of emotion, attention, auditory awareness, auditory memory, and behavioral response. These areas are believed to play a modulatory and regulatory role in tinnitus perception.
The degree of alteration in functional connectivity has been shown to have some correlation to the level of distress from tinnitus, the perception of tinnitus loudness and to the duration of the tinnitus [20, 21]. Leaver et al. observed that tinnitus patients exhibited hyperactivity in the Heschl’s gyri and in parts of the limbic system as revealed by functional Magnetic Resonance Imaging (fMRI). They report that tinnitus subjects appear to have structural differences in the white matter and gray matter concentration within the prefrontal cortex which might imply that tinnitus patients have less functional output from the prefrontal cortex [22].
The purpose of this study is to document the changes in neural activity that might contribute to tinnitus emergence, by comparing the waveform latencies and amplitudes of scalp recorded ALR and P300 responses in normal hearing young female adults who perceive temporary tinnitus after a brief exposure to sustained silence to the waveform latencies and amplitudes of normal hearing young female adults who do not perceive temporary tinnitus after a brief exposure to sustained silence. The study hypothesis is that mean ALR and P300 amplitudes will be larger in the participants who perceive temporary tinnitus when exposed to sustained silence. Results from this study will help document the neural responses of the auditory and non-auditory cortical regions associated with tinnitus-like perception. Thus, this study will broaden the present understanding of the differences in cortical responses that may underlie the tendency of some people to perceive tinnitus.
Materials and Methods
This was a prospective cross-sectional study. Approval for the study was obtained from the University of North Carolina Greensboro (UNCG) Institutional Review Board and approval for the COVID-19 safety protocol used in this study was obtained from the UNCG Ramp-up committee. Convenience sampling was employed. While there are no reported gender effects in the perception of temporary tinnitus in silence, there are differences in the ALR and P300 waveforms due to gender [14, 23]. Thus, only female participants were recruited for this study. The age range was limited to young adults aged 18 to 35 years to control for the potential effect of age on tinnitus and hearing [2, 3, 24]. The use of young adults was also done to control for the changes in ALRs due to aging Goodin et al.
Participants were recruited by means of fliers, email messages and in-person. Female participants without a history of chronic tinnitus aged 18-35 years, who gave their consent to participate in the study, were admitted to this study. Participants underwent otoscopy, tympanometry, and pure tone audiometry to determine that they met the normal hearing inclusion criteria. Otoscopy was performed with the use of a Heine Otoscope. Middle ear function was assessed using a Grason Stadler Inc. (GSI) Middle Ear Analyzer. A 226 Hz probe tone was used and pressure sweeps -200daPa through +200daPa. Participants with Modified Jerger type A tympanograms were admitted to the study. Hearing thresholds were assessed using a Grason Stadler Inc. (GSI) 61 clinical audiometer in a double-wall sound booth. All instruments were calibrated 2 months before the commencement of the study. Participants with pure tone hearing thresholds 25dBHL or less in octave frequencies 250Hz to 8000Hz, normal findings on otoscopy, Type A tympanograms bilaterally with peak pressure between -100 and +100 daPa were admitted to the study. No participant on anti-depressants, sedatives, anticonvulsant medications, or with a history of chronic ear infections, tinnitus, sound sensitivity, ear surgeries, concussions, head trauma, attention deficit disorder, attention deficit hyperactivity disorder, learning disability, speech-language disorder, central auditory processing disorder, seizures, or neurological disease was admitted to the study.
Intelligent Hearing Systems (IHS) Smart EP was used in recording the ALR and P300 waveforms. A protocol was created for right monoaural P300 recording with a timebase of 512 ms using tone bursts with 10 ms rise and fall times and 50 ms durations. ALR and P300 waveforms were elicited using 1000Hz (frequent) and 2000 Hz (rare) stimuli in an odd-ball paradigm [23]. Two hundred and fifty artifact free tone bursts were presented at 80dBHL intensity through the intelligent hearing systems Smart EP. Eighty percent of the tones were 1000Hz tones, and 20% of the tones were 2000Hz tones. The stimulus were presented monoaurally at a rate of 1.1/sec through 3A Etymotic ear inserts and was calibrated in dB HL23. Amplification was set at 1000 with highpass and lowpass filters being set at at 1hz to 30Hz respectively. The non-inverting electrode were placed on the vertex (Cz), inverting linked electrodes on the mastoid (M1 and M2); and ground electrode on the forehead (Fpz). Measured electrode impedance was kept below 5000 ohms.
Participants were seated in a soundproof booth on a comfortable reclining chair and asked to relax and keep their eyes open and focused on a point. Participants were informed that they will have two P300 tests and will be directed to ignore the frequent stimuli, silently keep count of the rare stimuli and to tap the arm of the reclining chair each time they hear the rare stimuli. They were also informed that they would be left in silence for ten minutes after the first P300 test and asked to take note of any experiences in silence, but they were not told to expect any sound. After impedance verification across the electrodes, both the frequent and rare rarefaction tone burst stimuli were presented through the right ER-3A insert transducer using the oddball paradigm in a pseudorandom order. The computer recorded and saved the electrophysiological potentials obtained from the electrodes. After the first ALR/P300 recording, participants were left in silence for ten minutes within the soundproof booth. Immediately after the ten minutes of silence, a second ALR/P300 measurement was recorded. The second ALR/P300 measurement followed the same protocol as the first. Once the second ALR/P300 test was concluded, participants were asked to fill a tenitem Qualtrics questionnaire (Appendix 1) in which they indicated if they heard any sounds in their head or ears while in silence and if they did, they described the type of sounds heard. Finally, the electrodes were removed, and the electrode locations cleaned with a wet wipe.
Individual raw ALR and P300 waveforms were analyzed for peak-to-peak latency and amplitude measures as well as muscle artifacts. Peak amplitude for the N1 and N2 waves were measured from the peak of the preceding positive wave to the lowest point on the N1 or N2 wave. Peak amplitude for the P2 wave was measured from the trough of the preceding N1 wave to the highest point on the P2 wave. The peak amplitude for the P300 was measured from its peak to the lowest point on the ensuing negative wave. Peak-to-peak latencies of the ALR and P300 waveforms were measured for both conditions. Amplitudes and latencies were entered into SPSS statistical software. Grand average waveforms were created for the two AEP recording conditions.
The mean/averaged latencies and amplitudes of the N1, P2 and P300 waveforms were compared between the group that perceived tinnitus in silence (Tinnitus in Silence group) and the group that did not perceive tinnitus in silence (No tinnitus group) and analyzed using Analysis of Variance (ANOVA) statistical test. The independent variables were the participant groups and the time points (Pre and Post silence) while the dependent variables were the mean latencies and amplitudes of the ALR and P300 potentials. Descriptive statistics and qualitative analysis were used in analyzing the tinnitus in silence questionnaire. All statistical tests were two-tailed, and level of significance set at P ≤ 0.05.
Results
Demographics: Thirty adult female participants were enrolled in the study, ALR and P300 waveforms with good signal to noise ratios were recorded for each participant.
The mean age of the participants was 22.5 ± 3.9 years. Their age ranged from 19 years to 35 years. In terms of race, sixteen (53.4%) of the participants were White and 12 (40%) were Black.
Tinnitus perception: When exposed to silence, a total of eight (26.7%) participants perceived tinnitus after sitting in silence for ten minutes. Five (62.5%) of the participants who perceived tinnitus were Black while three participants (37.5%) were White. There was no significant correlation between race and the perception of temporary tinnitus (χ2 (3, N=30) =2.6, p=0.5). The participants who heard tinnitus perceived the tinnitus sounds within the first five minutes of sitting in silence. The majority (50%) of the participants reported that they perceived tinnitus sounds in their head, 25% of the subjects that perceived tinnitus did so in both ears, a further 12.5% perceived the tinnitus sound in the left ear and 12.5% perceived the tinnitus sounds in their right ear. Four (50%) of the participants that perceived tinnitus described their tinnitus as having two or more sounds. The tinnitus sounds perceived in silence were more likely to be described as either buzzing or humming. Three (37.5%) of those who perceived tinnitus while sitting in silence described their tinnitus as having a pitch and 66.7% of these had mid-pitched tinnitus.
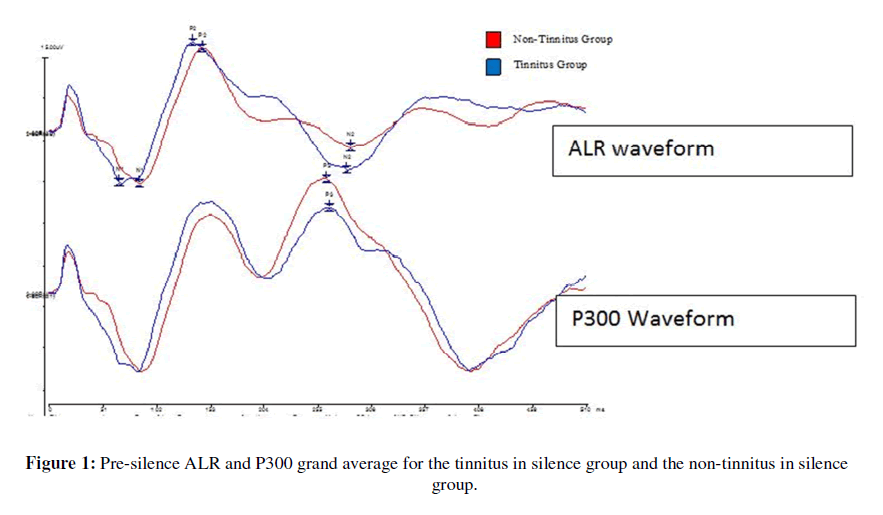
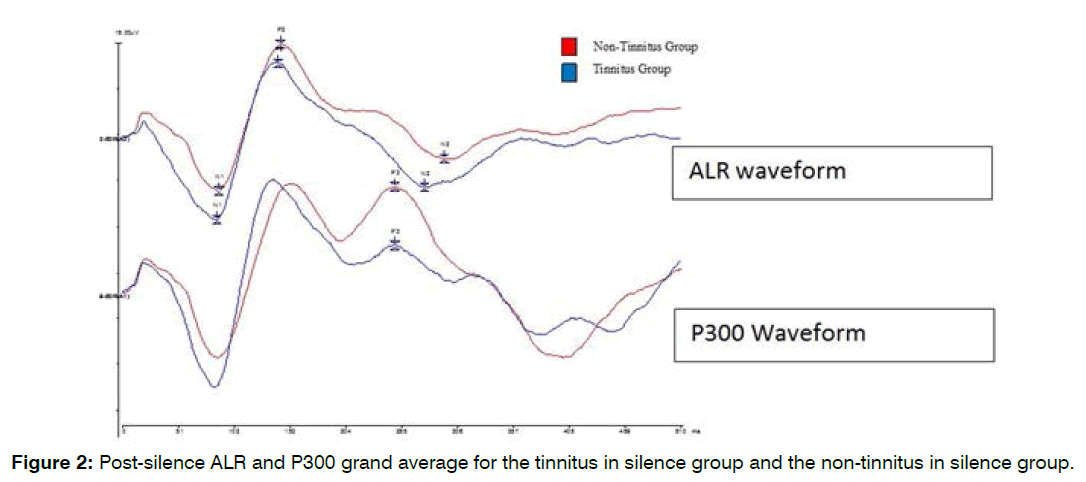
Tinnitus perception group differences in alr and p300 waveforms: Figures 1 and 2 show pre-silence and post-silence grand average recordings for the tinnitus in silence and non-tinnitus in silence groups. The P300 waveform amplitude in the tinnitus in silence group is smaller than that of the non-tinnitus in silence group in the pre-silence and post-silence test conditions. The tinnitus group shows faster N1 latency and larger N2 amplitude pre-silence. In the post-silence condition, the difference between the two waveforms shows a larger gap, with P300 amplitudes being smaller in the tinnitus perception group in the post-silence condition.
Figure 1: Pre-silence ALR and P300 grand average for the tinnitus in silence group and the non-tinnitus in silence group.
Figure 2: Post-silence ALR and P300 grand average for the tinnitus in silence group and the non-tinnitus in silence group.
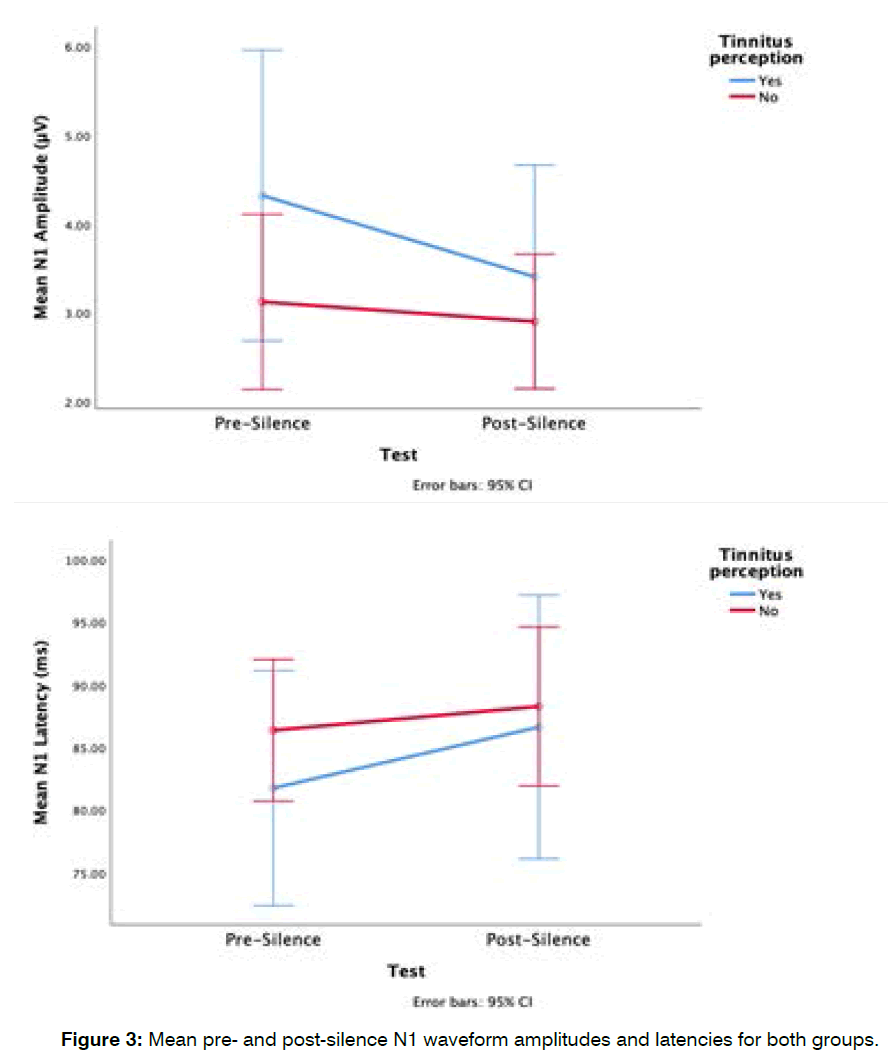
Group differences in mean pre-silence and postsilence n1 waveform: N1 waveform amplitude appeared smaller in the tinnitus-perception group after exposure to silence. The mean pre-silence N1 amplitude for the tinnitus perception group was 4.3 ± 3.2 μV and their post-silence N1 amplitude was 3.4 ± 1.9 μV, while the mean pre-silence N1 amplitude for the non-tinnitus perception group was 3.1 ± 1.9 μV and their post-silence N1 amplitude, 2.9 ± 1.7 μV (Figure 3). These was no significant main effects of groups (F (1,28) =1.2, p=0.3) and no significant interaction between tinnitus perception groups and time points (Pre and Post silence) (F (1,28)=1.12, p=0.3). N1 latencies increased after the exposure to silence. The mean pre-silence N1 latency for the tinnitus in silence group was 81.7 ± 14.1 ms and their post-silence N1 latency 86.6 ± 10.6 ms, while the mean pre-silence N1 latency for the non-tinnitus in silence group was 86.4 ± 12.6 ms and their post-silence N1 latency was 88.3 ± 15.6 ms (Figure 3). These differences in N1 waveform latencies were not statistically significant (F (1,28)=0.34, p=0.5). Although the tinnitus group showed a larger difference between pre- and post-silence mean latencies, there was no significant interaction between tinnitus perception groups and the points in time at which measurements were obtained (F (1,28)=0.63, p=0.4).
Figure 3: Mean pre- and post-silence N1 waveform amplitudes and latencies for both groups.
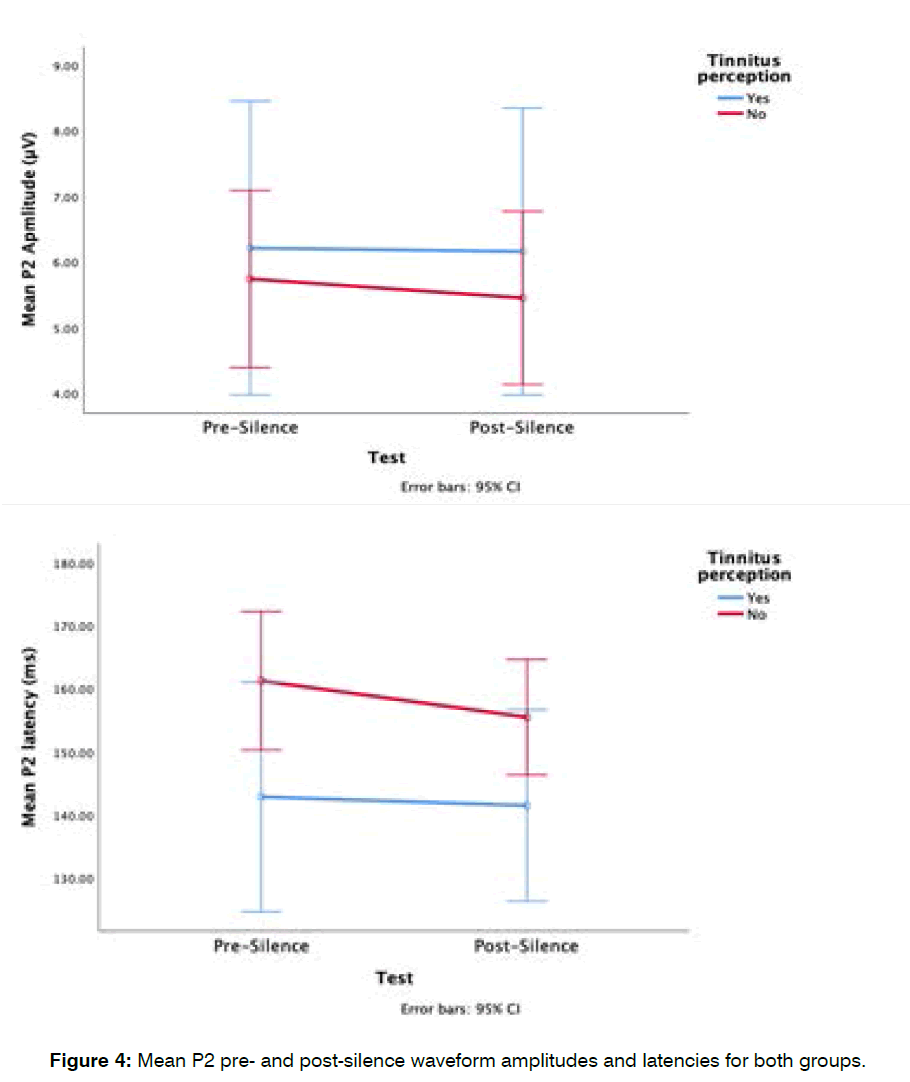
Group differences in mean pre-silence and post-silence p2 waveform: The mean pre-silence P2 amplitude for the tinnitus in silence group was 6.2 ± 3 μV and their postsilence P2 amplitude, 6.2 ± 2.9 μV, while the mean presilence P2 amplitude for the non-tinnitus in silence group was 5.7 ± 3.1 μV and their post-silence P2 amplitude was 5.5 ± 3.1 μV (Figure 4). These differences in P2 waveform amplitudes were not significant (F (1,28)=0.2, p=0.6), furthermore, there was no significant interaction between the groups and the time of ALR measurements (F (1,28)=0.25, p=0.6).
Figure 4: Mean P2 pre- and post-silence waveform amplitudes and latencies for both groups.
The mean pre-silence P2 latency for the tinnitus in silence group was 142.9± 10.3 ms and their post-silence P2 latency was 141.5 ± 8.6 ms, while the mean pre-silence P2 latency for the non-tinnitus in silence group was 161.3 ± 27.1 ms and their post-silence P2 latency, 155.5 ± 23.7 ms (Figure 4). There was no significant main effect of groups (F (1,28)=3.5, p=0.07) or significant interaction between participant groups and the time of ALR measurement; pre- or post- silence (F (1,28)=0.29, p=0.6).
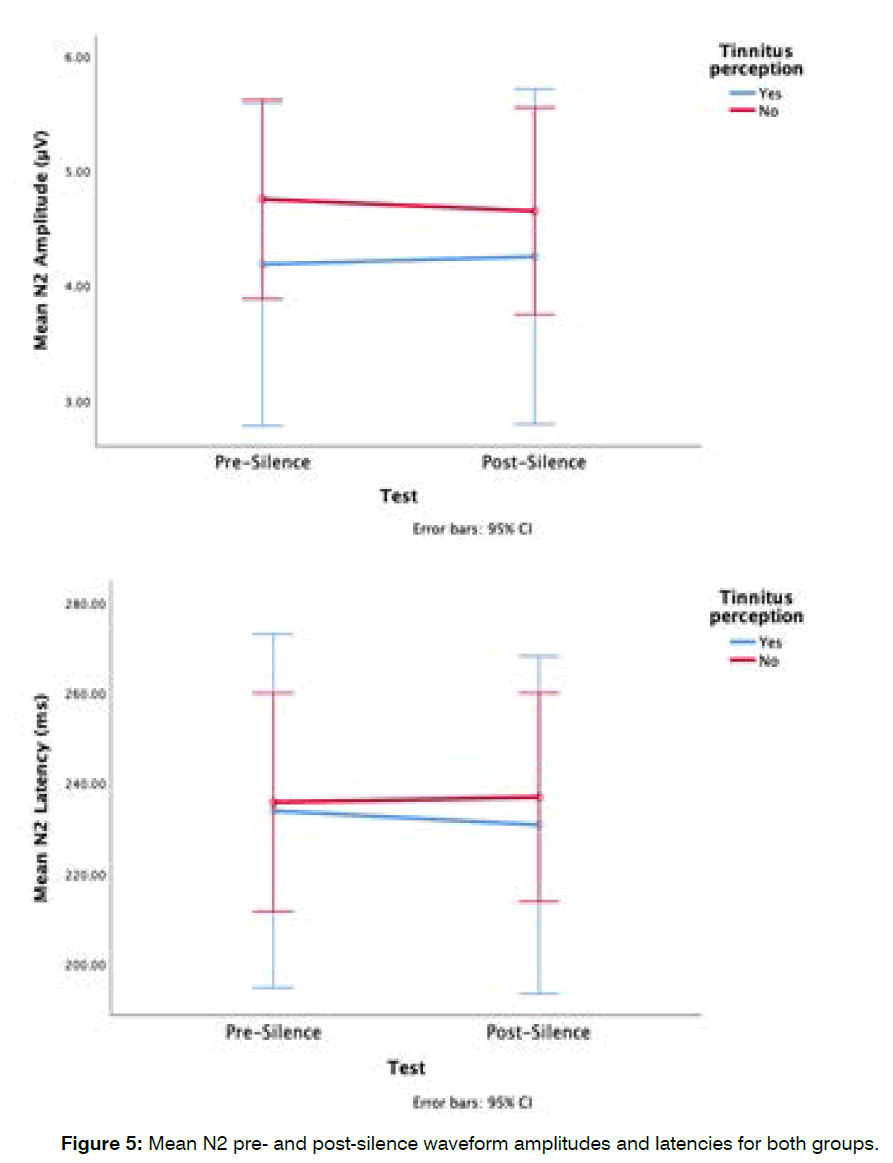
Group differences in mean pre-silence and postsilence n2 waveform: The tinnitus in silence group had smaller pre- and post-silence N2 amplitudes. The mean pre-silence N2 amplitude for the tinnitus in silence group was 4.2 ± 1.9 μV and their post-silence N2 amplitude 4.3 ± 1.8 μV, while the mean pre-silence N2 amplitude for the non-tinnitus in silence group was 4.8 2 μV and their postsilence N2 amplitude 4.7 ± 2.1 μV (Figure 5). There was no significant main effect of tinnitus group (F (1,27)=0.43, p=0.5), and no significant interaction between the tinnitus perception groups and the points in time at which measurements were obtained (F (1,27)=0.05, p=0.8). The mean pre-silence N2 latency for the tinnitus in silence group was 233.9 ± 49.9 ms and their post-silence N2 latency 230.8 ± 42.1 ms, while the mean pre-silence N2 latency for the non-tinnitus in silence group was 235.8 ± 55.4 ms and their post-silence N2 latency 236.9 ± 54.5 ms (Figure 5). There were no significant main effects of group on N2 waveform latencies (F (1,27)=0.04, p=0.9). Although the post-silence N2 latency showed a decrease in the tinnitus in silence group and an increase in the non-tinnitus group, there was no significant interaction between tinnitus perception group and the time points at which measurements were obtained (F (1,27)=0.16, p=0.7).
Figure 5: Mean N2 pre- and post-silence waveform amplitudes and latencies for both groups.
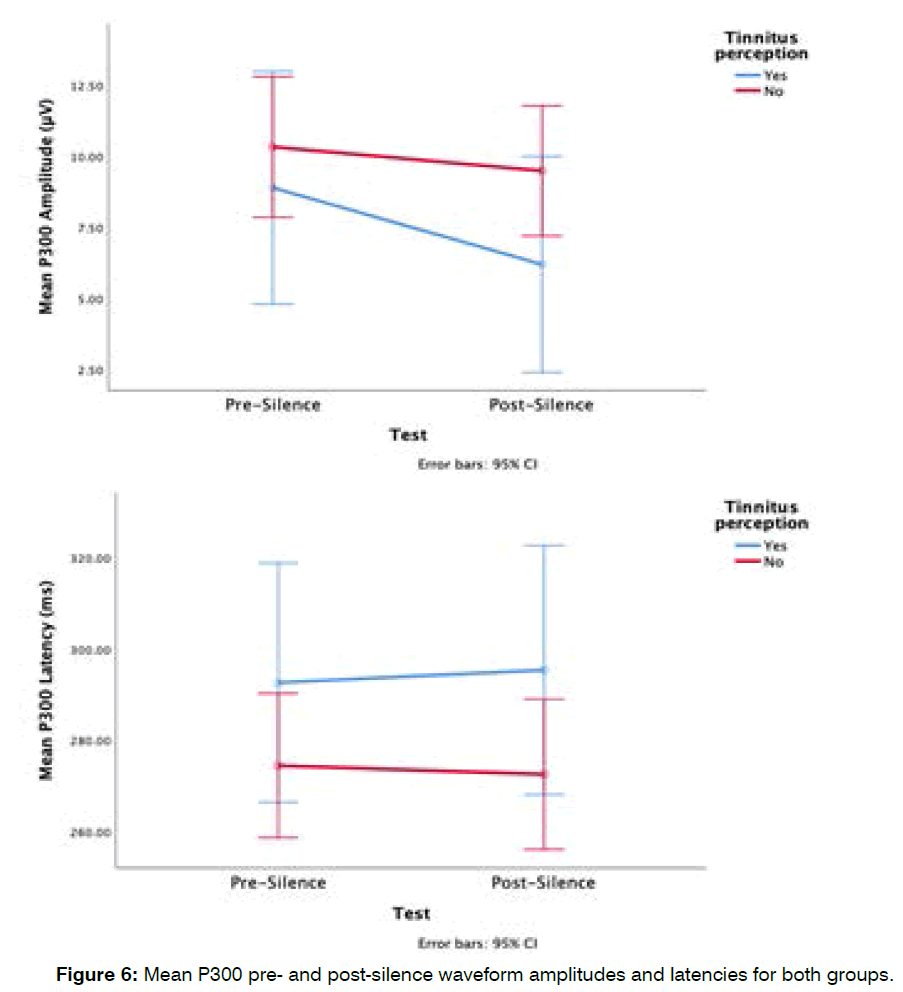
Group differences in mean pre-silence and postsilence p300 waveform: The tinnitus in silence group had smaller mean P300 amplitudes pre- and post-silence, with the difference between the two groups widening after exposure to silence (see Figure 2). The mean pre-silence P300 amplitude for the tinnitus in silence group was 8.8 ± 4.2 μV and their post-silence P300 amplitude was 6.2 ± 2.5 μV, while the mean pre-silence P300 amplitude for the non-tinnitus in silence group was 10.3 ± 6.1 μV and their post-silence P300 amplitude 9.5 ± 5.9 μV (Figure 6). There was no significant main effect of groups (F (1,28)=1.2, p=0.3), and no significant interaction between group and ALR measurement time points (F (1,28)=1.8, p=0.2). The tinnitus in silence group had longer latencies pre- and post-silence. The mean pre-silence P300 latency for the tinnitus in silence group was 292.6 ± 40.3 ms and their post-silence P300 latency was 295.4 ± 38.3 ms, while the mean pre-silence P300 latency for the non-tinnitus in silence group was 274.5 ± 34.6 ms and their post-silence P300 latency, 272.6 ± 37.4 ms (Figure 6). These group differences were not statistically significantly different (F (1,28)=2, p=0.2). Although the tinnitus group showed a slightly faster P300 response post-silence, there was no significant interaction between the tinnitus perception group and the time points at which ALR measurements were obtained (F (1,28)=0.23, p=0.6).
Figure 6: Mean P300 pre- and post-silence waveform amplitudes and latencies for both groups.
Discussion
Perception of tinnitus in silence: The current study found that 26.7% of the normal hearing adult female participants perceived tinnitus in silence. The proportion of those who perceived tinnitus in this study is much less than the number reported in the study by Tucker et al., (64%) and Heller and Bergman, 1953 (94%). This may be because of differences in subject demographic as well as differences in study protocol and instructions given to the participants. The participants in Heller and Bergman, were older and were not confirmed to have normal hearing [13]. The participants in Tucker et al. sat in a soundproof booth for 20 minutes, but the participants in this study stayed in silence for 10 minutes in a soundproof booth wearing ear plugs [14]. The proportion of those who perceived tinnitus in this study was also less than the number reported by Knobel and Sanchez, 2008 and Del Bo et al., 2008. Both studies documented the role of auditory attention in the perception of temporary tinnitus in silence and they observed that a greater proportion of people without chronic tinnitus are likely to perceive tinnitus in silence when their attention is drawn to their auditory system [9, 12]. In the present study, participants were not given any indication that they might perceive sounds in silence, and the lack of auditory attention may explain the number of participants who perceived temporary tinnitus in silence.
The results from this current study show that the association between race and tinnitus perception was not significant. This finding does not agree with the results of the study by Tucker et al. and this may be attributed to a smaller sample size as well as the differences in protocol used in both studies. However, of the eight participants who perceived tinnitus after an exposure to silence, five of them were black (62.5%), which is opposite of the Tucker et al. study who found a higher incidence of tinnitus perception in white participants.
Effect of tinnitus perception on ALR and p300 waveforms: The group differences observed in P300 waveform did not reach a statistically significant difference. More research is needed to determine if the response of the non-auditory regions responsible for regulating auditory attention, auditory memory and response inhibition are different in people who tend to perceive tinnitus. Further research is needed on the network theory which postulates that non-auditory regions within the frontal, parietal and hippocampal regions have a role to play in tinnitus perception and the response to tinnitus.
Few studies have documented the cortical responses that underlie the emergence of tinnitus and studies in people with chronic tinnitus. These studies have reported inconsistent findings such as smaller P300 amplitudes in tinnitus participants in studies by Said, and Attias et al. and larger mean P300 amplitudes in tinnitus participants in a study by Vasudevan et al. [19, 25, 26]. Much like the present study, Attias 1993, Abdeltawwab & Elmorsy, 2013 and Houdayer et al., 2015 did not observe a significant difference in P300 latencies when they compared subjects with chronic tinnitus to normal controls without tinnitus [19, 27, 28]. Participants in the study by Houdayer et al. and Abdeltawwab & Elmorsy, were normal hearing tinnitus subjects and this may explain the similarities between the finding in that study and the results in the present study. Houdayer et al. reported longer P300 latencies and smaller P300 amplitudes in tinnitus participants, but this difference did not achieve statistical significance, which matches the trend found in the current study.
Larger mean N1 amplitudes and shorter N1 latencies were observed in the tinnitus group pre-silence, however, these group differences and interactions between group and test time were not statistically significant. The findings from the present study agree with the reports from some studies in people with chronic tinnitus [18, 19, 25, 26, 29]. The N1 wave is believed to be a marker of conscious detection of a sound signal and a large N1 wave may reflect problems with auditory habituation, thus additional research is needed to understand the role of the contributing auditory and frontal cortical regions in tinnitus perception and emergence.
The tinnitus group showed a tendency to have larger P2 amplitudes and faster P2 latency responses in both the pre-silence and the post-silence test conditions. Although this difference was not significant, it aligns with previous reports of increased auditory cortical neuron excitability in people with tinnitus [30-32].
It is curious that the tinnitus in silence group showed higher neuronal reactivity in the auditory cortical neurons (N1 and P2 amplitude and latency), but this was not mirrored in the non-auditory network regions believed to play a modulatory role in tinnitus detection (P300 amplitude and latency). This may reflect a mismatch between the neuronal response in the auditory cortex and the modulatory network regions. Additional research with a is needed to understand if the emergence of tinnitus is linked to a dysregulation or mismatch between the neuronal response in auditory cortical regions and the neuronal response in non-auditory modulatory regions. Based on results from this study, a minimum of 80 participants would be needed to achieve the ideal sample size needed to detect any significant differences.
The overall findings from this study may suggest that the processing speed and strength of neuronal response in the auditory cortical neurons may differ in those participants who experience tinnitus emergence after silence exposure. However, the limitations of the present study include a small sample size, the dependence on subjective reports of tinnitus perception in silence, and the use of one gender for participants. To further explore the concept of tinnitus emergence due to dysregulation between the auditory cortical regions and the modulatory network regions, additional research should focus on comparing the pre-silence and post-silence neural responses in the auditory cortex documented with the Auditory Middle Latency Response (AMLR) test and the non-auditory modulatory regions documented with the P300 auditory response in individuals who experience chronic tinnitus and in those who experience tinnitus in silence. The comparison of the AMLR waveform to the P300 waveform will improve our understanding of the central gain theory and its relationship to the network theory of tinnitus generation. Additional research is needed to determine if there are significant differences in ALR and P300 waveforms after silence exposure in male participants. Furthermore, there is need for a longitudinal study to document if there is a link between the emergence of temporary tinnitus in silence and the actual development of tinnitus later in life, this would clarify if tinnitus can be predicted by the emergence of temporary tinnitus in silence. There is a need for continued research in tinnitus to understand the underlying mechanisms behind tinnitus perception and the distress from tinnitus. This will contribute to the existing knowledge on tinnitus and improve the odds of arriving at an effective therapy for tinnitus.
Conclusion
ALR and P300 waveform latencies and amplitudes were not significantly different when participants who perceived temporary tinnitus in silence were compared to those who did not perceive tinnitus in silence. However, grand averaged waveforms showed a trend in P300 amplitudes being smaller in participants who experience tinnitus perception after a brief exposure to silence. Additional research is needed to understand the differences in cortical responses that may predispose normal hearing individuals to the emergence of tinnitus or that may occur in individuals who perceive tinnitus.
References
- Baguley D, McFerran D, HallD. Tinnitus. The Lancet. 2013;382(9904):1600-7.
- McCormack A, Edmondson-Jones M, Somerset S, Hall D. A systematic review of the reporting of tinnitus prevalence and severity. Hearing Res. 2016;337:70-9.
- Shargorodsky J, Curhan GC, Farwell WR. Prevalence and characteristics of tinnitus among US adults. The Am J Med. 2010;123(8):711-8.
- Mahboubi H, Oliaei S, Kiumehr S, Dwabe S, Djalilian HR. The prevalence and characteristics of tinnitus in the youth population of the United States. The Laryngoscope. 2013;123(8):2001-8.
- CDC. Public Health and Scientific Information. Center for Disease Control and Prevention.2018.
- Sedley W. Tinnitus: does gain explain?. Neuroscience. 2019;407:213-28.
- Schaette R, Kempter R. Development of tinnitus‐related neuronal hyperactivity through homeostatic plasticity after hearing loss: A computational model. Eur J Neurosci. 2006;23(11):3124-38.
- Rauschecker JP, Leaver AM, Mühlau M. Tuning out the noise: limbic-auditory interactions in tinnitus. Neuron. 2010;66(6):819-26.
- Knobel KA, Sanchez TG. Influence of silence and attention on tinnitus perception. Otolaryngology—Head and Neck Surg. 2008;138(1):18-22.
- Mühlau M, Rauschecker JP, Oestreicher E, Gaser C, Röttinger M, Wohlschläger AM, et al. Structural brain changes in tinnitus. Cerebral Cortex. 2006;16(9):1283-8.
- Lanting CP, De Kleine E, Van Dijk P. Neural activity underlying tinnitus generation: results from PET and fMRI. Hearing Res. 2009;255(1-2):1-3.
- Bo LD, Forti S, Ambrosetti U, Serena C, Mauro D, Ugazio G, et al. Tinnitus aurium in persons with normal hearing: 55 years later. Otolaryngology–Head and Neck Surg. 2008;139(3):391-4.
- MF H. Tinnitus aurium in normally hearing persons. The Ann Otol Rhinol, and Laryngol. 1953;62(1):73-83.
- Tucker DA, Phillips SL, Ruth RA, Clayton WA, Royster E, Todd AD. The effect of silence on tinnitus perception. Otolaryngol—Head and Neck Surg. 2005;132(1):20-4.
- Norena AJ, Eggermont JJ. Changes in spontaneous neural activity immediately after an acoustic trauma: implications for neural correlates of tinnitus. Hearing Res. 2003;183(1-2):137-53.
- Frodl-Bauch T, Bottlender R, Hegerl U. Neurochemical substrates and neuroanatomical generators of the event-related P300. Neuropsychobiol. 1999;40(2):86-94.
- Azevedo AAd, Figueiredo RR, Penido NdO. Tinnitus and event related potentials: a systematic review. Brazilian J Otorhinolaryngolo. 2020;86(1):119-26.
- Santos Filha VA, Matas CG. Late Auditory evoked potentials in individuals with tinnitus. Brazilian J Otorhinolaryngol. 2010;76:263-70.
- Attias J, Urbach D, Gold S, Shemesh Z. Auditory event related potentials in chronic tinnitus patients with noise induced hearing loss. Hearing Res. 1993;71(1-2):106-13.
- Paraskevopoulos E, Dobel C, Wollbrink A, Salvari V, Bamidis PD, Pantev C. Maladaptive alterations of resting state cortical network in Tinnitus: A directed functional connectivity analysis of a larger MEG data set. Sci Reports. 2019;9(1):1-1.
- Chen YC, Xia W, Chen H, Feng Y, Xu JJ, Gu JP, et al. Tinnitus distress is linked to enhanced resting‐state functional connectivity from the limbic system to the auditory cortex. Human Brain Mapping. 2017;38(5):2384-97.
- Leaver AM, Renier L, Chevillet MA, Morgan S, Kim HJ, Rauschecker JP. Dysregulation of limbic and auditory networks in tinnitus. Neuron. 2011;69(1):33-43.
- Hall JW. New handbook of auditory evoked responses. Pearson; 2007.
- Bhatt JM, Lin HW, Bhattacharyya N. Prevalence, severity, exposures, and treatment patterns of tinnitus in the United States. JAMA Otolaryngol–Head & Neck Surg. 2016;142(10):959-65.
- Vasudevan H, Palaniswamy HP, Balakrishnan R. Sensory and cognitive components of auditory processing in individuals with tinnitus. Am J Audiol. 2019;28(4):834-42.
- Said EA. Electrophysiological differences in sensorineural hearing loss patients with and without problem-tinnitus. The Egyptian J Otolaryngol. 2012;28(1):22-34.
- Houdayer E, Teggi R, Velikova S, Gonzalez-Rosa JJ, Bussi M, Comi G, et al. Involvement of cortico-subcortical circuits in normoacousic chronic tinnitus: A source localization EEG study. Clin Neurophysiol. 2015;126(12):2356-65.
- Elmorsy SM, Abdeltawwab MM. Auditory P300: selective attention to 2 KHZ tone-bursts in patients with idiopathic subjective tinnitus. Int J. 2013;1(1):7.
- Jacobson GP, McCaslin DL. A reexamination of the long latency N1 response in patients with tinnitus. J Am Academy of Audiol. 2003;14(07):393-400.
- Wang H, Brozoski TJ, Turner JG, Ling L, Parrish JL, Hughes LF, et al. Plasticity at glycinergic synapses in dorsal cochlear nucleus of rats with behavioral evidence of tinnitus. Neurosci. 2009;164(2):747-59.
- Wu C, Wu X, Yi B, Cui M, Wang X, Wang Q, et al. Changes in GABA and glutamate receptors on auditory cortical excitatory neurons in a rat model of salicylate-induced tinnitus. Am J Translational Res. 2018;10(12):3941.
- Yang S, Weiner BD, Zhang LS, Cho SJ, Bao S. Homeostatic plasticity drives tinnitus perception in an animal model. Proceedings of the National Acad of Sci. 2011;6;108(36):14974-9.
Department of Communication Sciences and Disorders, University of North Carolina, Greensboro, United States
Send correspondence to:
Ukaegbe Onyinyechi
Department of Communication Sciences and Disorders, University of North Carolina, Greensboro, United States, E-mail: onyikasi@yahoo.com
Paper submitted on July 05, 2022; and Accepted on August 03, 2022
Citation: Ukaegbe Onyinyech. Exploring the Effect of Silence on Auditory Network Regions in Young Female Adults who Experience Temporary Tinnitus on Exposure to Silence. Int Tinnitus J. 2022;26(2):79-88.


