The International Tinnitus Journal
Official Journal of the Neurootological and Equilibriometric Society
Official Journal of the Brazil Federal District Otorhinolaryngologist Society
ISSN: 0946-5448

Google scholar citation report
Citations : 12717
The International Tinnitus Journal received 12717 citations as per google scholar report
The International Tinnitus Journal peer review process verified at publons
Indexed In
- Excerpta Medica
- Scimago
- SCOPUS
- Publons
- EMBASE
- Google Scholar
- Euro Pub
- CAS Source Index (CASSI)
- Index Medicus
- Medline
- PubMed
- UGC
- EBSCO
Volume 28, Issue 1 / June 2024
Research Article Pages:104-111
10.5935/0946-5448.20240017
Using Non-Contrast Magnetic Resonance Imaging for Detection of Vestibular Schwannoma Assessment: A Systematic Review and Diagnostic Accuracy Meta-Analysis.
Authors: Zeinab Safarpour Lima, Samaneh Azimi Souteh, Ayda Roostaee
PDF
Abstract
Background and Aim: Non-contrast magnetic resonance imaging (MRI) offers high spatial resolution without the need for contrast agents and has been recognized as a useful imaging technique since the early 1990s. The study aimed to evaluate the effectiveness of T2wi compared to gadolinium-enhanced T1-weighted imaging in diagnosing VS. Methods: We performed a systematic search of literature in PubMed, Web of Science, and Scopus with relevant keywords. Studies that did not perform MRI or had insufficient data were excluded. Data extraction was performed based on a standardized sheet. Meta analysis was performed with STATA, R, and RStudio. Results: The initial search retrieved 6,088 articles from which 1,872 duplicates were removed. Finally, 10 studies were included based on our eligibility criteria. The pooled sensitivity of MRI in detection of vestibular schwannoma on patient level was 97% (95% CI: 82% - 100%, p-value < 0.01) and its specificity was 98% (95% CI: 89% - 100%, p-value < 0.01). The pooled sensitivity of MRI in detection of vestibular schwannoma on ear level was 98% (95% CI: 87% - 100%, p-value < 0.01) and its specificity on ear level was 99% (95% CI: 96% - 99%, p-value < 0.01). The pooled mean dice score was 87.42 (95%CI: 82-92). Conclusion: Non-contrast MR imaging offers precise evaluations of vestibular schwannoma in comparison to enhanced T1-weighted imaging. T2wi shows outstanding diagnostic precision for vestibular schwannomas and presents strong reliability in diagnostic evaluations.
Keywords: Vestibular schwannoma, Neoplasm, Lesion, Diagnostic accuracy, Magnetic resonance imaging, MRI,
Sensitivity, Specificity, Acoustic neuroma
Introduction
Acoustic neuromas, also known as vestibular schwannomas, vestibular neuromas, or acoustic neurofibromas, originate from Schwann cells and can be intracranial or extra-axial tumors. Typically located near the cochlear or vestibular nerve, they often occupy the cerebellopontine angle. Approximately 20% of tumors affecting the internal carotid artery are meningiomas, which may occur elsewhere in the brain [1-3]. Bilateral acoustic neuromas are predominantly seen in individuals with type 2 neurofibromatosis. Comprising 6–10% of all brain tumors, acoustic schwannomas are histopathologically benign and commonly arise from the sheath of cranial nerve VIII. As they grow, they exert pressure on cranial nerves VII, VIII, and V, as well as the brainstem, leading to symptoms such as tinnitus, hearing loss, dizziness, vertigo, and gait instability. Treatment options for acoustic schwannomas include observation, microsurgery, and radiation therapy. The choice of treatment depends on factors such as the tumor's size and location, the patient's hearing level, and their age [4-6].
As the prevalence of incidental and asymptomatic tumors increases, more patients and healthcare providers opt for serial MRI monitoring. Typically, follow-up MRI scans are conducted initially every 6 months, and later at intervals of 12 to 24 months. Currently, gadolinium-enhanced T1-weighted imaging (GdT1wi) is widely regarded as the standard method for detecting Vestibular Schwannomas (VS) [7-11]. Regardless of the chosen treatment approach (surgery, stereotactic radiosurgery, or conservative management), patients with VS typically undergo multiple GdT1wi scans during sequential follow-up to assess tumor growth [12-14].
The use of contrast agents in MRI scans, such as gadolinium-based agents, is associated with various drawbacks, including time consumption, costliness, and potential side effects like allergic reactions and nephrogenic systemic fibrosis. Moreover, recent radiology studies have indicated that gadolinium-based contrast agents can accumulate in the brain parenchyma. As an alternative to gadolinium-enhanced T1-weighted imaging (GdT1wi), some research suggests utilizing high-resolution T2-weighted magnetic resonance imaging (T2wi) for monitoring Vestibular Schwannomas (VS) [15-17]. T2wi offers high spatial resolution without the need for intravenous contrast agents and has been recognized as a useful imaging technique since the early 1990s. This study aimed to assess whether T2wi could serve as an effective monitoring tool compared to GdT1wi in patients with VS. The objective was to determine whether T2wi could accurately diagnose VS.
Materials and Methods
This systematic review and meta-analysis study was conducted based on the Preferred Reporting Items for Systematic reviews and Meta-Analyses (PRISMA) guideline 2020 [18].
Search strategy: Two authors performed a systematic search of literature in the following electronic databases: PubMed, Web of Science, and Scopus. No time limitation was defined and all English studies from the beginning until April, 2024 were included. The relevant medical subject heading (MeSH) terms and related keywords were used in combination to build the search strategy; (“magnetic resonance imaging” OR “MRI”) AND (“vestibular schwannoma” OR “acoustic schwannoma” OR “vestibular neuroma”).
Eligibility criteria: Our eligibility criteria were defined based on the PICO framework: (P) Population: patients suspected for VS. (I) Not Applicable. (C) MRI findings. (O) detection of VS lesions. Those studies that did not perform MRI or did not perform any diagnostic accuracy measures were excluded. Studies that performed other imaging modalities, lacked individual data, or were not in English, were also excluded.
Data extraction and outcome measures: A standardized Excel sheet was prepared for data extraction. Two independent authors performed the data extraction based on the aforementioned data extraction sheet. Disagreement between these two authors, regarding inclusion, exclusion or data extraction, was discussed and resolved by a third author. The data extraction sheet included the following study characteristics: first author’s name, year of publication, study design, country, true positive, true negative, false positive, false negative, total number of cases, mean age, and reference of comparison.
Data synthesis and Statistical Analysis: We used R (R Foundation for Statistical Computing, Vienna, Austria), RStudio (RStudio, Inc., Boston, MA), and STATA 17.0 for the statistical analysis and creating the figures. The pooled sensitivity and specificity were calculated based on metadta package in STATA and mada package in R. The sensitivity and specificity were pooled using the hierarchical logistic regression. The Diagnostic Odds Ratio (DOR), Negative Likelihood Ratio (NEGLR), and Positive Likelihood Ratio (POSLR) were calculated and graphed using mada package in R. The 95% confidence interval was also estimated using the binomial distribution. The forest plots and Receiver Operating Characteristic (SROC) plots were also created [19-21].
Results
Our initial search retrieved 6,088 articles from PubMed, Scopus, and Web of Science, from which 1,872 duplicates were removed. After screening the title and abstract of 4,216 records, 63 full texts were retrieved, among which 10 studies (Figure 1) were included based on our eligibility criteria [6, 8, 9, 13, 17, 22-26]. Among the 10 included studies, 9 [6, 8, 9, 13, 17, 22-25] were included in the meta-analysis and 1 study did not enter this process [26]. More detail regarding the study characteristics of the included studies is summarised in (Table 1).
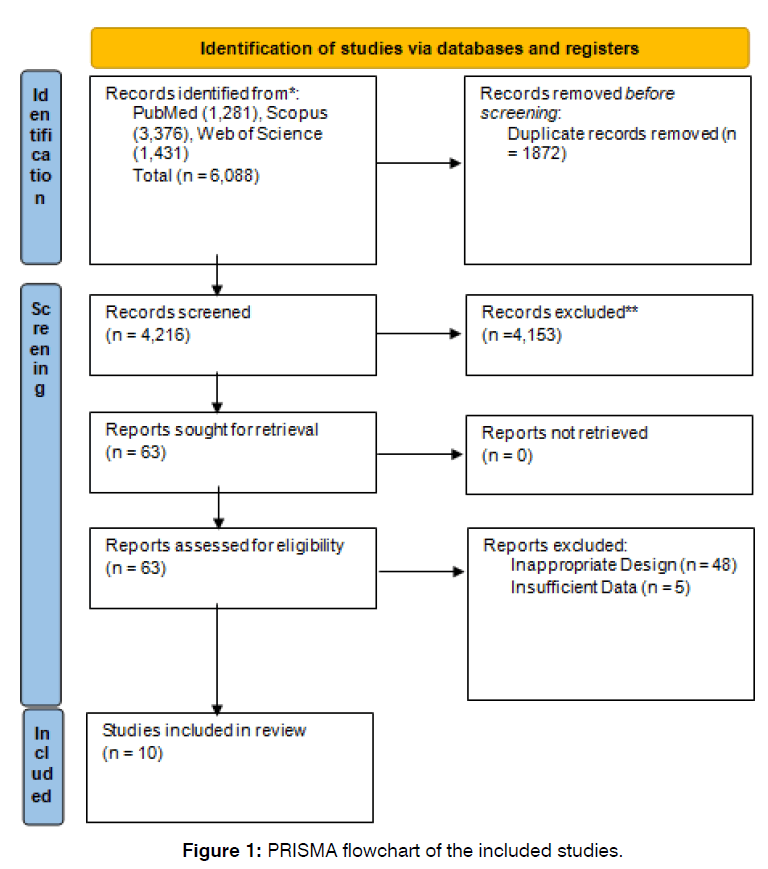
Figure 1: PRISMA flowchart of the included studies.
| Pooled Statistics for Patient Level Outcomes | |||||||
| Study | Year | SEN | 95%CI | p | SPC | 95%CI | p |
| Overall | - | 97 | 82-100 | <0.01 | 98 | 89-100 | <0.01 |
| Hentschel et al. (22) | 2018 | 87 | 60-98 | - | 99 | 98-100 | - |
| Karol et al. (23) | 2018 | 78 | 58-91 | - | 73 | 54-87 | - |
| Marx et al. (6) | 1999 | 100 | 69-100 | - | 100 | 78-100 | - |
| Neve et al. (24) | 2022 | 100 | 97-100 | - | 98 | 91-100 | - |
| Soulie et al. (9) | 1998 | 100 | 86-100 | - | 93 | 85-97 | - |
| Valesano et al. (13) | 2018 | 91 | 76-98 | - | 100 | 89-100 | - |
| Heterogeneity | Tau2 | I2 | |||||
| Generalized | 7.06 | 32.45% | |||||
| Sensitivity | 2.93 | 30.05% | |||||
| Specificity | 2.66 | 37.26% | |||||
| Pooled Statistics for Ear Level Outcomes | |||||||
| Study | Year | SEN | 95%CI | p | SPC | 95%CI | p |
| Overall | - | 98 | 87-100 | <0.01 | 99 | 96-99 | <0.01 |
| Hentschel et al. (22) | 2018 | 90 | 73-98 | - | 100 | 99-100 | - |
| Karol et al. (23) | 2018 | 92 | 88-95 | - | 98 | 97-99 | - |
| Marx et al. (6) | 1999 | 100 | 72-100 | - | 100 | 91-100 | - |
| Neve et al. (24) | 2022 | 100 | 98-100 | - | 98 | 94-100 | - |
| Soulie et al. (9) | 1998 | 100 | 93-100 | - | 93 | 88-96 | - |
| Valesano et al. (13) | 2018 | 91 | 76-98 | - | 100 | 96-100 | - |
| Heterogeneity | Tau2 | I2 | |||||
| Generalized | 1.38 | 25.72% | |||||
| Sensitivity | 3.83 | 23.96% | |||||
| Specificity | 0.87 | 47.88% | |||||
| Pooled Statistics for Dice Score | |||||||
| Study | Year | Mean | 95%CI | I2 | Tau2 | p-value | n |
| Overall | - | 87.42 | 82.82-92.02 | 100% | 21.25 | <0.01 | 672 |
| Neve et al. (24) | 2022 | 82 | - | - | - | - | 112 |
| Neves et al. (25) | 2023 | 89 | - | - | - | - | 122 |
| Shapey et al. (8) | 2019 | 93 | - | - | - | - | 243 |
| Yao et al. (17) | 2022 | 85 | - | - | - | - | 195 |
Table 1: The pooled sensitivity, specificity and heterogeneity of the included studies
The pooled sensitivity of MRI in detection of vestibular schwannoma on patient level was 97% (95% CI: 82% - 100%, p-value < 0.01). The pooled specificity MRI in detection of vestibular schwannoma on patient level was 98% (95% CI: 89% - 100%, p-value < 0.01). Further detail is available in (Figures 2 & 3).
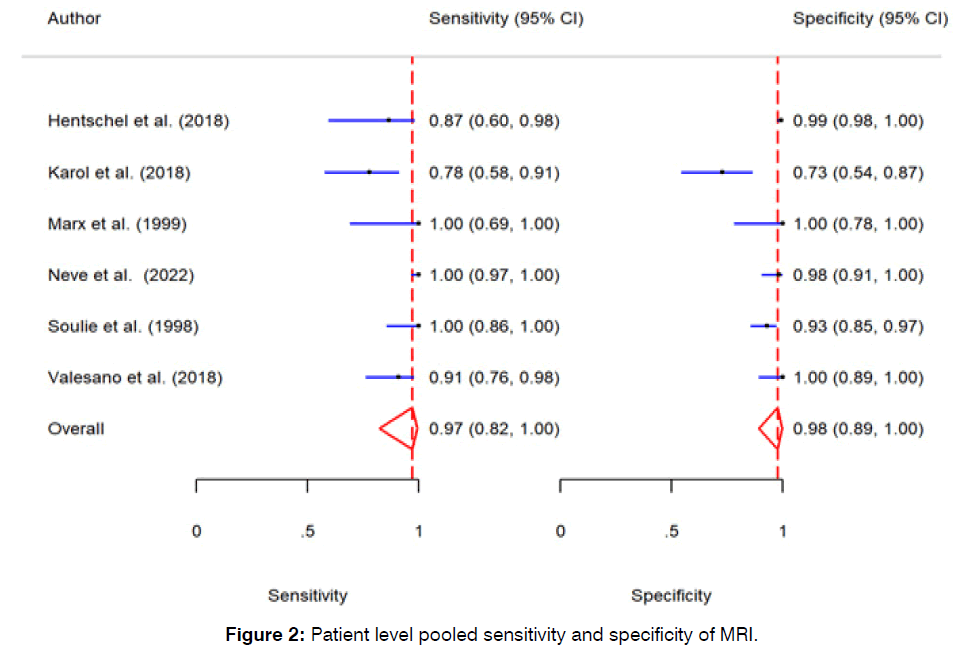
Figure 2: Patient level pooled sensitivity and specificity of MRI.
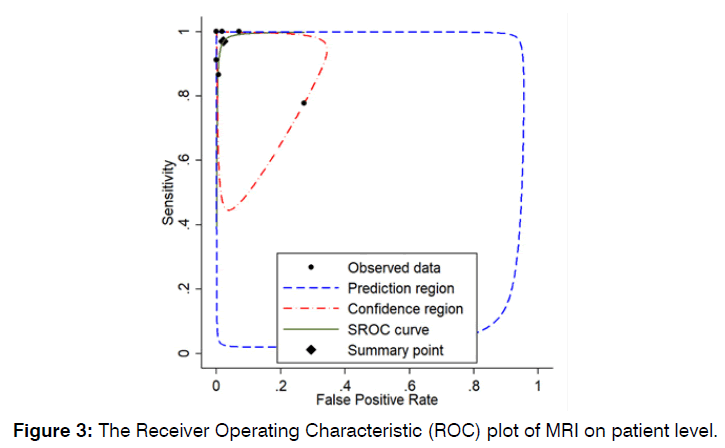
Figure 3: Receiver Operating Characteristic (ROC) plot of MRI on patient level.
The pooled sensitivity of MRI in detection of vestibular schwannoma on ear level was 98% (95% CI: 87% - 100%, p-value < 0.01). The pooled specificity MRI in detection of vestibular schwannoma on ear level was 99% (95% CI: 96% - 99%, p-value < 0.01). Further detail is available in (Figures 4 & 5).
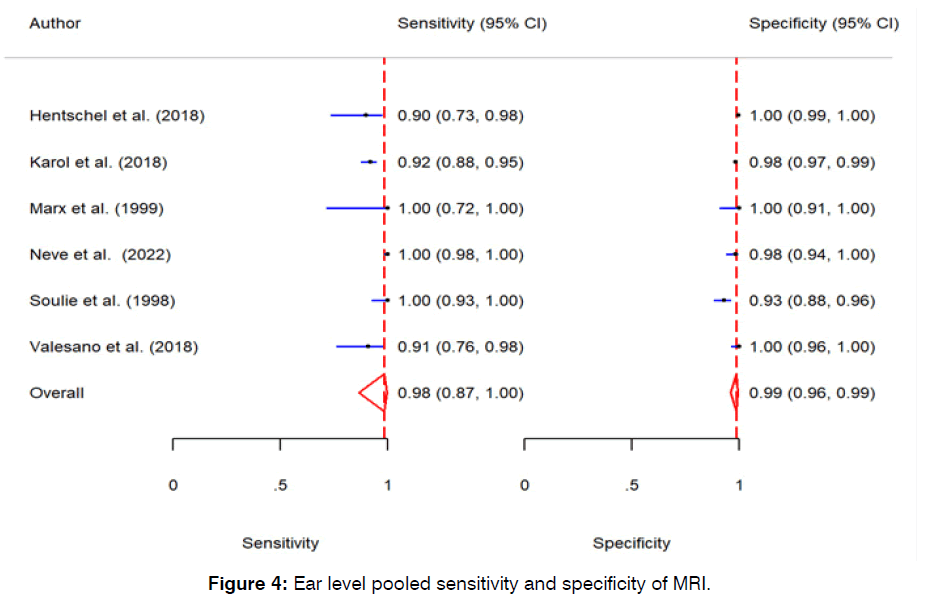
Figure 4: Ear level pooled sensitivity and specificity of MRI.
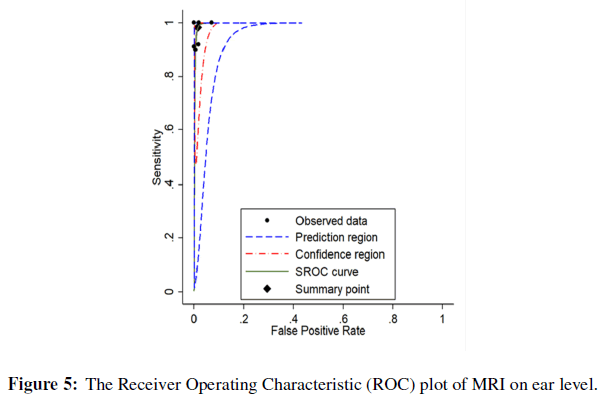
Figure 5: The Receiver Operating Characteristic (ROC) plot of MRI on patient level.
The pooled mean dice score was 87.42 (95%CI: 82-92). Although the patient level and ear level studies did not show any significant heterogeneity, the Dice score showed significant heterogeneity with I2 of 100% and p-value of less than 0.01. Further information regarding forest of Dice score is summarized in (Figure 6). The Diagnostic Odds Ratio (DOR) and negative and positive likelihood ratios are summarized in Appendix 1-6.
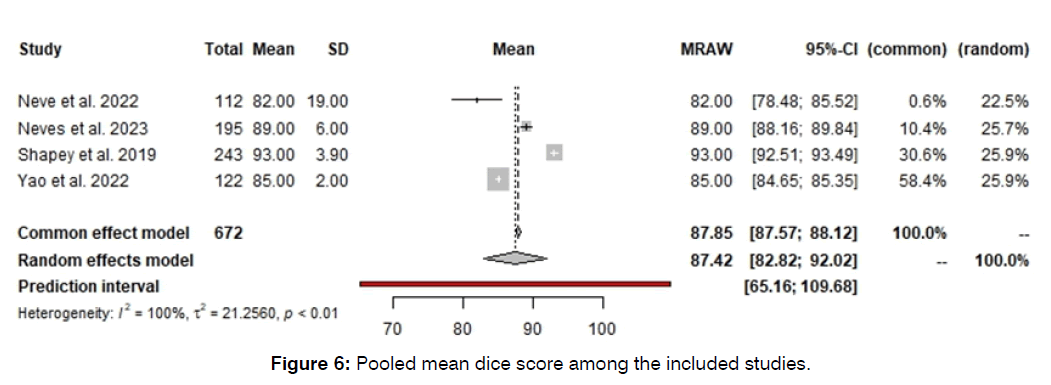
Figure 6: Pooled mean dice score among the included studies.
Discussion
Based on the findings of our systematic review and meta-analysis study, MRI had high sensitivity and specificity for detecting vestibular schwannomas. The pooled sensitivity and specificity of MRI in detection of vestibular schwannoma on patient and ear level was 97%, 98%, 98%, and 99%, respectively. The pooled mean dice score was also 87.42%. Overall, the studies have shown low heterogeneity for sensitivity and specificity, however, the dice score showed high levels of heterogeneity.
Two systematic reviews have conducted comparative analyses of high-resolution T2-weighted imaging (T2w) and gadolinium-enhanced T1-weighted imaging (GdT1w) in the assessment of vestibular schwannoma. Both reviews concluded that GdT1w, considered the gold standard, exhibited high sensitivity and specificity [1, 27, 28]. Interestingly, there were no observed differences in measured tumor diameter between T2w and GdT1w sequences. Moreover, the specific T2w protocol utilized did not influence the reported sensitivity or specificity. Kim et al. noted that despite variations in protocols, the T2 dephasing remained similar, with differences primarily attributed to the characteristics of the MRI machines. This allowed for the grouping of protocols for comparison purposes [29-31].
The advancement in MRI sequencing has facilitated the accurate identification of vestibular schwannoma without the need for contrast agents. Hentschel et al. conducted a study highlighting that specialized training in radiological interpretation was not essential. In their research, they demonstrated this by having a medical doctor, who had received only a brief tutorial and had no prior experience in neuroradiology, serve as the second examiner [32-35]. Despite the absence of formal training, there was strong agreement between raters, indicating that accurate interpretation of noncontrast T2-weighted images can be achieved even without specific expertise in neuroradiology [22, 36-38].
The findings of this study suggest that a noncontrast MRI protocol, such as T2-weighted imaging (T2wi), is comparable to conventional MRI protocols, like gadolinium-enhanced T1-weighted imaging (GdT1wi), in assessing the size of vestibular schwannomas (VS). Additionally, our analysis indicates that T2wi is as effective as GdT1wi in detecting VS [5, 39, 40]. Furthermore, the study demonstrates the excellent reliability of T2wi, with high agreement observed among both inter- and intraobserver evaluations. These results support the use of noncontrast T2wi for the detection and monitoring of patients with VS [10, 40-42].
The utilization of a paramagnetic contrast agent enhances the delineation of tumor boundaries, enabling radiologists to distinguish acoustic neuromas from other Cerebellopontine Angle (CPA) tumors, including meningiomas, with exceptional precision [15, 16, 43]. However, this enhancement comes with notable drawbacks, including increased financial expenses compared to non-contrast MRI, and nearly doubling the duration of the procedure. Moreover, there is a risk of complications such as nephrogenic systemic fibrosis associated with the use of contrast agents [16, 17, 44].
Previous research has explored the feasibility of utilizing non-contrast T2-weighted imaging (T2wi) for the accurate diagnosis of Vestibular Schwannoma (VS). A comprehensive review of the literature, including univariate meta-analyses of sensitivity and specificity, indicated that non-contrast MRI demonstrated high sensitivity and cost-effectiveness in diagnosing acoustic neuromas. High-resolution T2wi was deemed to be of adequate quality for reliably diagnosing VS of any size and could potentially replace routine contrast-enhanced T1-weighted imaging (T1wi) [7, 45, 46]. However, it is worth noting that pooling sensitivity and specificity data may lead to overestimation due to the negative correlation often observed within studies. Hence, more sophisticated statistical approaches are warranted in meta-analyses of diagnostic test accuracy [12, 14, 26, 47].
The SROC (Summary Receiver Operating Characteristic) approach has emerged as the preferred method for meta-analyzing studies that provide both sensitivity and specificity data. This approach transforms each sensitivity-specificity pair into a single measure of accuracy known as the Diagnostic Odds Ratio (DOR). One advantage of the DOR approach is its ability to address the inherent correlation between sensitivity and specificity values [2, 4, 48, 49].
Additionally, it accommodates the heterogeneity across studies arising from variations in the thresholds chosen by researchers. Considering this negative curvilinear correlation is crucial when pooling data for meta-analyses. The DORs can be effectively utilized in meta-analyses of diagnostic studies. Therefore, we conducted a bivariate meta-analysis using DORs instead of pooling sensitivity and specificity data. Furthermore, we assessed the inter- and intra-observer agreement to evaluate the reliability of high-resolution T2-weighted imaging [3, 50, 51].
Conclusion
The findings of this meta-analysis suggest that T2-weighted imaging (T2wi) provides accurate measurements of vestibular schwannoma when compared to gadolinium-enhanced T1-weighted imaging (GdT1wi). T2wi exhibits excellent diagnostic accuracy for vestibular schwannomas (VS) and demonstrates high reliability in diagnostic assessments. Nevertheless, additional studies are necessary to validate the outcomes of our investigation.
References
- Burns SS, Chang LS. Generation of noninvasive, quantifiable, orthotopic animal models for NF2-associated schwannoma and meningioma. Aud Vestib Res. 2016:59-72.
- Dang L, Tu NC, Chan EY. Current imaging tools for vestibular schwannoma. Curr Opin Otolaryngol Head Neck Surg. 2020;28(5):302-7.
- Epprecht L, Kozin ED, Piccirelli M, Kanumuri VV, Tarabichi O, Remenschneider A, et al. Super-resolution diffusion tensor imaging for delineating the facial nerve in patients with vestibular schwannoma. J Neurol Surg B Skull Base. 2019;80(06):648-54.
- Dhayalan D, Tveiten ØV, Finnkirk M, Storstein A, Hufthammer KO, Goplen FK, et al. Upfront radiosurgery vs a wait-and-scan approach for small-or medium-sized vestibular schwannoma: the V-REX randomized clinical trial. JAMA. 2023;330(5):421-31.
- Lee S, Hwang SH. Non-contrast magnetic resonance imaging for diagnosis and monitoring of vestibular schwannomas: a systematic review and meta-analysis. Otol Neurotol. 2019;40(9):1126-33.
- Marx SV, Langman AW, Crane RC. Accuracy of fast spin echo magnetic resonance imaging in the diagnosis of vestibular schwannoma. Am J Otolaryngol. 1999;20(4):211-6.
- Schwartz N, Rooth MA, Dillon MT, O'Connell BP, Dedmon MM, Huang BY, et al. MRI surveillance following concurrent cochlear implantation in cases of vestibular schwannoma resection. Am J Otolaryngol. 2020;41(4):102518.
- Shapey J, Wang G, Dorent R, Dimitriadis A, Li W, Paddick I, et al. An artificial intelligence framework for automatic segmentation and volumetry of vestibular schwannomas from contrast-enhanced T1-weighted and high-resolution T2-weighted MRI. J Neurosurg. 2019;134(1):171-9.
- Soulie D, Cordoliani YS, Vignaud J, Cosnard G. MR imaging of acoustic neuroma with high resolution fast spin echo T2-weighted sequence. Eur J Radiol. 1997;24(1):61-5.
- Springborg JB, Poulsgaard L, Thomsen J. Nonvestibular schwannoma tumors in the cerebellopontine angle: a structured approach and management guidelines. J Neurol Surg B Skull Base. 2008:217-27.
- Heydari MH, Sadeghian A, Khadivi G, Mustafa HJ, Javinani A, Nadjmi N, et al. Prevalence, trend, and associated risk factors for cleft lip with/without cleft palate: a national study on live births from 2016 to 2021. BMC Oral Health. 2024;24(1):36.
- Sudhoff H, Gehl HB, Scholtz LU, Todt I. MRI observation after intralabyrinthine and vestibular schwannoma resection and cochlear implantation. Front Neurol. 2020;11:759.
- Valesano JC, Carr CM, Eckel LJ, Carlson ML, Lane JI. MRI screening of the internal auditory canal: Is gadolinium necessary to detect intralabyrinthine schwannomas?. Am J Otolaryngol. 2018;39(2):133-7.
- Wiesmueller M, Kopp M, Sievert M, May MS, Nagel AM, Iro H, et al. Comparison of vestibular schwannoma visualization between 0.55 T and 1.5 T MRI. Eur J Radiol. 2023;165:110927.
- Williams JC, Carr CM, Eckel LJ, Kotsenas AL, Hunt CH, Carlson ML, et al. Utility of noncontrast magnetic resonance imaging for detection of recurrent vestibular schwannoma. Otol Neurotol. 2018;39(3):372-7.
- Yamada H, Kai N, Hiratsuka Y, Mitani S, Suehiro S, Shiraishi Y, et al. Comparison of the Signal Intensity of Vestibular Schwannoma Between Growing and Nongrowing Tumors. Laryngoscope Investig Otolaryngol. 2022;132(1):198-203.
- Yao P, Shavit SS, Shin J, Selesnick S, Phillips CD, Strauss SB. Segmentation of Vestibular Schwannomas on Postoperative Gadolinium-Enhanced T1-Weighted and Noncontrast T2-Weighted Magnetic Resonance Imaging Using Deep Learning. Otol Neurotol. 2022;43(10):1227-39.
- Page MJ, McKenzie JE, Bossuyt PM, Boutron I, Hoffmann TC, Mulrow CD, et al. The PRISMA 2020 statement: an updated guideline for reporting systematic reviews. BMJ. 2021;372.
- Nyaga VN, Arbyn M. Metadta: a Stata command for meta-analysis and meta-regression of diagnostic test accuracy data–a tutorial. Arch Pub Health. 2022;80(1):95.
- Harbord RM, Whiting P. Metandi: meta-analysis of diagnostic accuracy using hierarchical logistic regression. Stata J. 2009;9(2):211-29.
- Doebler P, Holling H. Meta-analysis of diagnostic accuracy and ROC curves with covariate adjusted semiparametric mixtures. Psychometrika. 2015;80(4):1084-104.
- Hentschel M, Scholte M, Steens S, Kunst H, Rovers M. The diagnostic accuracy of non-imaging screening protocols for vestibular schwannoma in patients with asymmetrical hearing loss and/or unilateral audiovestibular dysfunction: a diagnostic review and meta-analysis. Clin Otolaryngol. 2017;42(4):815-23.
- Karol A, Veillon F, Huynh T, Severac F, Charpiot A, Venkatasamy A. Is an intravenous injection of gadolinium really necessary for intralabyrinthine schwannomas MR examination?. Otol Neurotol. 2018;39(7):e579-84.
- Neve OM, Chen Y, Tao Q, Romeijn SR, de Boer NP, Grootjans W, et al. Fully Automated 3D vestibular schwannoma segmentation with and without gadolinium-based contrast material: A multicenter, multivendor study. Radiol Artif Intell. 2022;4(4):e210300.
- Neves CA, Liu GS, El Chemaly T, Bernstein IA, Fu F, Blevins NH. Automated Radiomic Analysis of Vestibular Schwannomas and Inner Ears Using Contrast-Enhanced T1-Weighted and T2-Weighted Magnetic Resonance Imaging Sequences and Artificial Intelligence. Otol Neurotol. 2023;44(8):e602-9.
- Tolisano AM, Wick CC, Hunter JB. Comparing linear and volumetric vestibular schwannoma measurements between T1 and T2 magnetic resonance imaging sequences. Otol Neurotol. 2019;40(5S):S67-71.
- Arribas L, Chust ML, Menéndez A, Arana E, Vendrell JB, Crispín V, et al. Non surgical treatment of vestibular schwannoma. Acta Otorrinolaringol. 2015;66(4):185-91.
- Buch K, Juliano A, Stankovic KM, Curtin HD, Cunnane MB. Noncontrast vestibular schwannoma surveillance imaging including an MR cisternographic sequence: is there a need for postcontrast imaging?. J Neurosurg. 2018;131(2):549-54.
- Carlson ML, Dowling EM, Lohse CM, O’Connell BP, Driscoll CL, Haynes DS, et al. Rate of initial hearing loss during early observation predicts time to non-serviceable hearing in patients with conservatively managed sporadic vestibular schwannoma. Otol Neurotol. 2019;40(10):e1012-7.
- Choi KJ, Sajisevi MB, Kahmke RR, Kaylie DM. Incidence of retrocochlear pathology found on MRI in patients with non-pulsatile tinnitus. Otol Neurotol. 2015;36(10):1730-4.
- Crowson MG, Rocke DJ, Hoang JK, Weissman JL, Kaylie DM. Cost-effectiveness analysis of a non-contrast screening MRI protocol for vestibular schwannoma in patients with asymmetric sensorineural hearing loss. Am J Neuroradiol. 2017;59:727-36.
- Daniels RL, Shelton C, Harnsberger HR. Ultra high resolution nonenhanced fast spin echo magnetic resonance imaging: cost-effective screening for acoustic neuroma in patients with sudden sensorineural hearing loss. Otolaryngol Head Neck Surg. 1998;119(4):364-9.
- Dardis A, Donghun K, Kontorinis G. Growing versus non-growing vestibular schwannomas: assessment of natural history. J Laryngol Otol. 2022;136(10):934-8.
- Fisher LM, Doherty JK, Lev MH, Slattery III WH. Distribution of nonvestibular cranial nerve schwannomas in neurofibromatosis 2. Otol Neurotol. 2007;28(8):1083-90.
- Forgues M, Mehta R, Anderson D, Morel C, Miller L, Sevy A, et al. Non-contrast magnetic resonance imaging for monitoring patients with acoustic neuroma. J Laryngol Otol. 2018;132(9):780-5.
- Hunter JB, O’Connell BP, Wanna GB, Bennett ML, Rivas A, Thompson RC, et al. Vestibular schwannoma growth with aspirin and other nonsteroidal anti-inflammatory drugs. Otol Neurotol. 2017;38(8):1158-64.
- Jacob A, Igarashi S, Platto T, Khan R, Jain R. The solid component of radiographically non-growing, post-radiated vestibular schwannoma retains proliferative capacity: implications for patient counseling. Ann Otol Rhinol Laryngol. 2015;124(10):834-40.
- Jay WM, Williamson MR. Incidence of subcortical lesions not increased in nonarteritic ischemic optic neuropathy on magnetic resonance imaging. Am J Ophthalmol. 1987;104(4):398-400.
- Levo H, Pyykkö I, Blomstedt G. Non-surgical treatment of vestibular schwannoma patients. Acta Otolaryngol. 1997;117(sup529):56-8.
- Osawa I, Kozawa E, Tanaka S, Kaizu A, Inoue K, Ikezono T, et al. Signal and morphological changes in the endolymph of patients with vestibular schwannoma on non-contrast 3D FLAIR at 3 Tesla. BMC Med Imaging. 2021;21:1-3.
- Saxby C, Koumpa F, Mohamed S, Singh A. The use of magnetic resonance imaging in the investigation of patients with unilateral non-pulsatile tinnitus without asymmetrical hearing loss. J Laryngol Otol. 2021;135(8):680-3.
- Vaz MA, Gonçalves RF, Lavinsky J, Isolan GR, Lavinsky Sr J, Isolan Sr GR. Non-Hodgkin Lymphoma Mimicking Vestibular Schwannoma. Cureus. 2023;15(12).
- Venkatasamy A, Bretz P, Karol A, Karch-Georges A, Charpiot A, Veillon F. MRI of endolymphatic hydrops in patients with intralabyrinthine schwannomas: a case-controlled study using non-enhanced T2–weighted images at 3 T. Eur Arch Otorhinolaryngol. 2021;278:1821-7.
- Zou J, Hirvonen T. “Wait and scan” management of patients with vestibular schwannoma and the relevance of non-contrast MRI in the follow-up. J Audiol Otol. 2017;12(4):174-84.
- Peto I, Noureldine MH, Zavadskiy G, Pressman E, Flores-Milan G, van Loveren H, et al. Postoperative magnetic resonance imaging signal changes in middle cerebral peduncle after vestibular schwannoma surgery. Br J Neurosurg. 2022;36(6):712-9.
- Puccinelli C, Carlson ML. Improvement or recovery from sudden sensorineural hearing loss with steroid therapy does not preclude the need for MRI to rule out vestibular schwannoma. Otol Neurotol. 2019;40(5):674-80.
- Strauss C, Rampp S, Scheller C, Prell J, Strauss C, Doerfler A, et al. Volumetry and surgical grading systems for vestibular schwannoma size assessment and their relationship to postoperative facial nerve function. JNLSA. 2022;83(01):039-45.
- Dai Q, Zheng M, Chen Q, Zheng H, Li B. The Preoperative Diagnostic Value of MRI and Otoneural Tests in Acoustic Neuroma. Front Oncol. 2021;11:626485.
- Eliezer M, Poillon G, Maquet C, Gillibert A, Horion J, Marie JP, et al. Sensorineural hearing loss in patients with vestibular schwannoma correlates with the presence of utricular hydrops as diagnosed on heavily T2-weighted MRI. Diagn Interv Imaging. 2019;100(5):259-68.
- Fieux M, Zaouche S, Rabaste S, Riche B, Maucort-Boulch D, Tringali S. MRI monitoring of residual vestibular schwannomas: modeling and predictors of growth. Otol Neurotol. 2020;41(8):1131-9.
- George-Jones NA, Chkheidze R, Moore S, Wang J, Hunter JB. MRI texture features are associated with vestibular schwannoma histology. Laryngoscope Investig Otolaryngol. 2021;131(6):E2000-6.
Department of Radiology, School of Medicine, Iran University of Medical Sciences, Tehran, Iran
Send correspondence to:
Ayda Roostaee
Department of Radiology, School of Medicine, Iran University of Medical Sciences, Tehran, Iran, E-mail: ayda152001@yahoo.com
Paper submitted on May 07, 2024; and Accepted on June 03, 2024
Citation: Israa Talib Abd Al Kadir. Using Non-Contrast Magnetic Resonance Imaging for Detection of Vestibular Schwannoma Assessment: A Systematic Review and Diagnostic Accuracy Meta-Analysis. Int Tinnitus J. 2024;28(1):104-111


